|
RIVERS - INDEX A TO Z
PLEASE USE OUR A-Z INDEX TO NAVIGATE THIS SITE |
||||||||||||||||||||||||||||||||||||||||||||||||||||||||||||||||||||||||||||||||||||||||||||||||||||||||||||||||||||||||||||||||||||||||||||||||||||||||||||||||||||||||
Around ninety percent (90%) of plastics in the ocean comes from just 10 rivers. Nine of these rivers are located in Asia and one of them borders Thailand.
Local waterways act like conveyor belts, taking plastic from land straight out to sea.
The top 10 most polluted rivers in the world have one thing in common – they are located alongside large human populations with poor waste management (PWM) systems.
Previous research has found about one-fifth of total ocean plastic trash comes from marine activities – plastic tossed from fishing boats, ships, drilling platforms and so on. The four-fifths from land totals 4.8 million to 12.7 million tonnes a year.
So, how many of the offenders are being prosecuted? Not many is any. What does that suggest to you. Would you agree that policies must be ineffective, or perhaps corrupt politicians are turning a blind eye, in return for some kind of reward? The fact is there are no prosecutions. The free dumping of waste continues, poisoning the fish we eat.
Please let us know if you've heard of anyone dumping waste into rivers being prosecuted.
SKY DECEMBER 2017 - According to the Helmholtz Centre for Environmental Research in Leipzig, the Yangtze was the worst offender, reference research published in the journal Environmental Science & Technology. This Chinese river carries up to 1.5 million tonnes of plastic into the sea every year. In contrast, the Thames in the UK puts 18 tonnes of plastic into the ocean.
While most plastic comes from coastal cities and towns, where plastic litter is washed into storm drains and flows into the sea, new research by scientists from the Helmholtz Centre for Environmental Research and the Weihenstephan-Triesdorf University of Applied
Science (both in Germany) highlights the importance of better management of upstream systems to reduce the significant proportion of plastic transferred via rivers.
Once the plastic is washed out to sea, it harder to track and collect. Confirmed plastic hot-spots would be prime targets for SeaVax machines operating in RiverVax mode.
River exits are a logical target if we want to start cleaning up our oceans cost effectively.
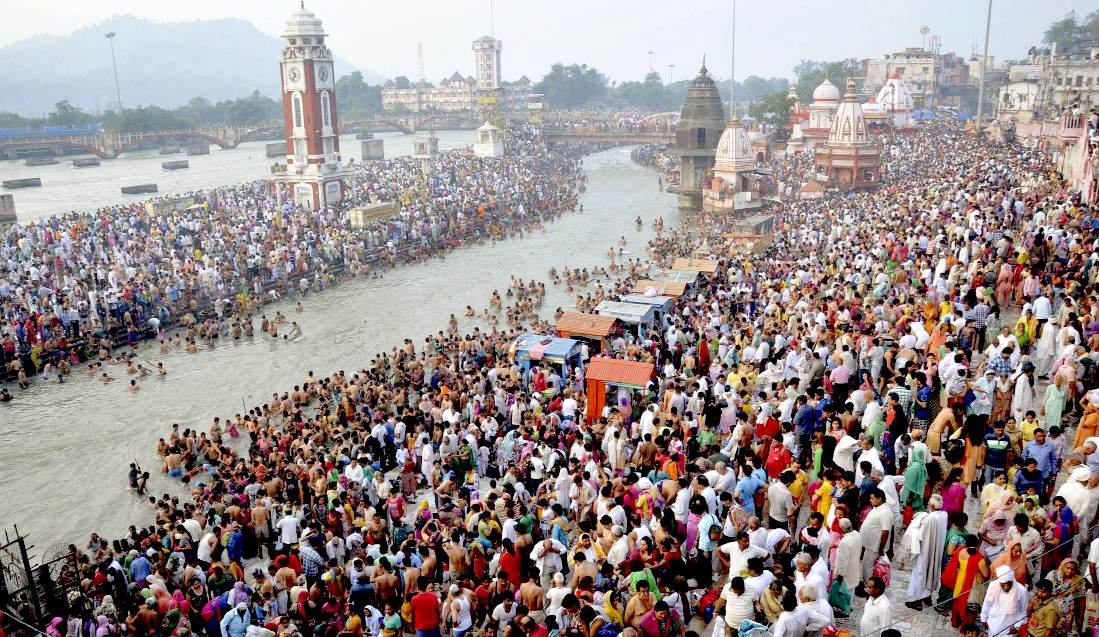
HOLY GANGA - The Ganges is considered to be the fifth most polluted river in the world. It contains human waste and industrial contaminants, but provides water for about 40% of India's population, yet millions of Indians depending on it for their daily needs. In 2015 this river was considered to be the 2nd worst polluter.
Every
year the world, produces 300 million tonnes of plastics, and 8.8 million tonnes of these are dumped into the oceans. That’s about 40 billion
plastic
bottles, 100 billion single-use plastic
bags, and 522 million personal care items.
Approximately 700 marine species are in danger of extinction because of plastic pollution.
If you know a seriously polluted river, or one that should be a candidate on a bigger list, please contact Cleaner Ocean Foundation.
The rivers noted, added to hundreds of other lesser contributors feed the five ocean gyres.
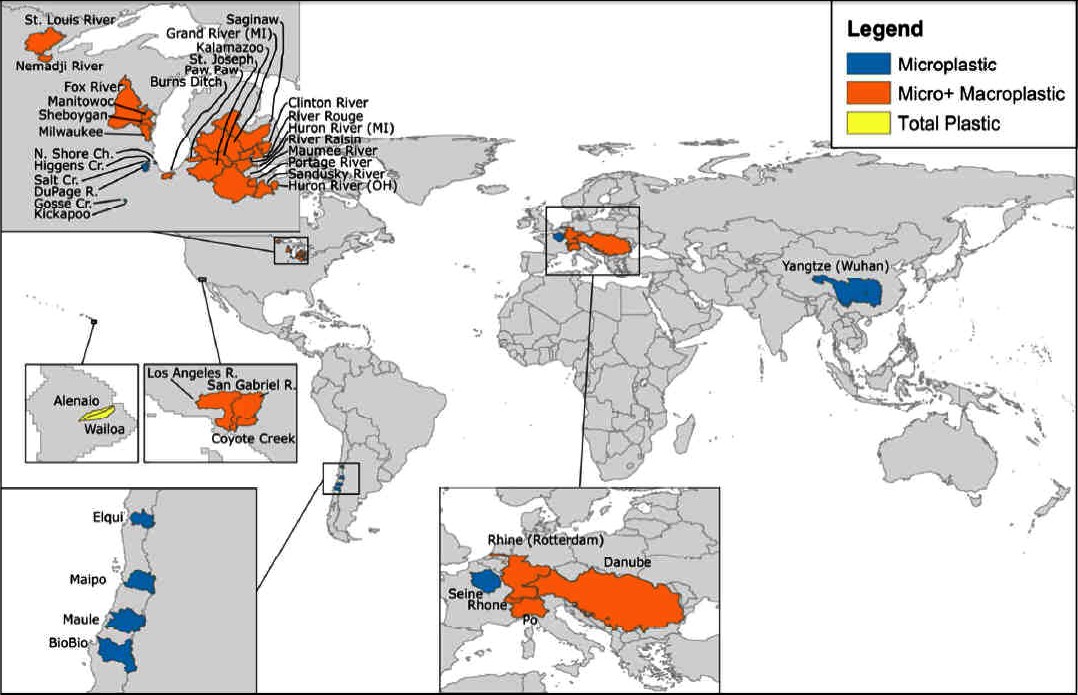
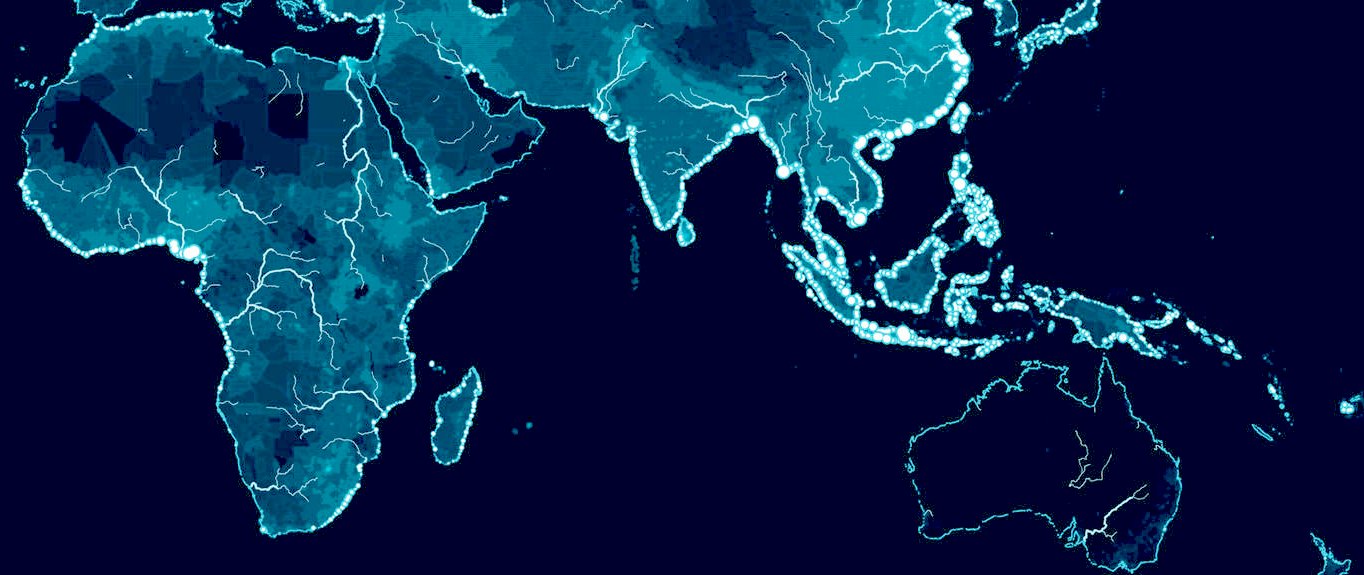
SCHMIDT OCT 2017 - A substantial fraction of marine plastic debris originates from land-based sources. Rivers potentially act as a major transport pathway for all sizes of plastic debris.
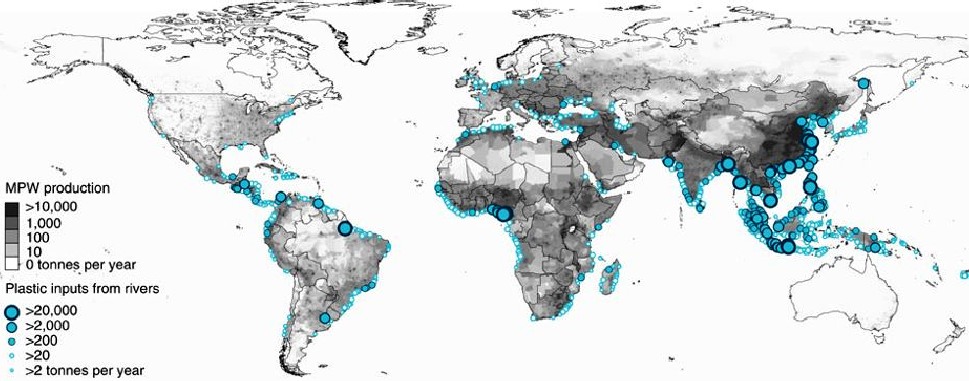
LAURENT LEBRETON 2017 - Mass of river plastic flowing into oceans in tonnes per year. River contributions are derived from individual watershed characteristics such as population density, mismanaged plastic waste (MPW) production per country and monthly averaged runoff. The model is calibrated against river plastic concentration measurements from Europe, Asia, North and South America.
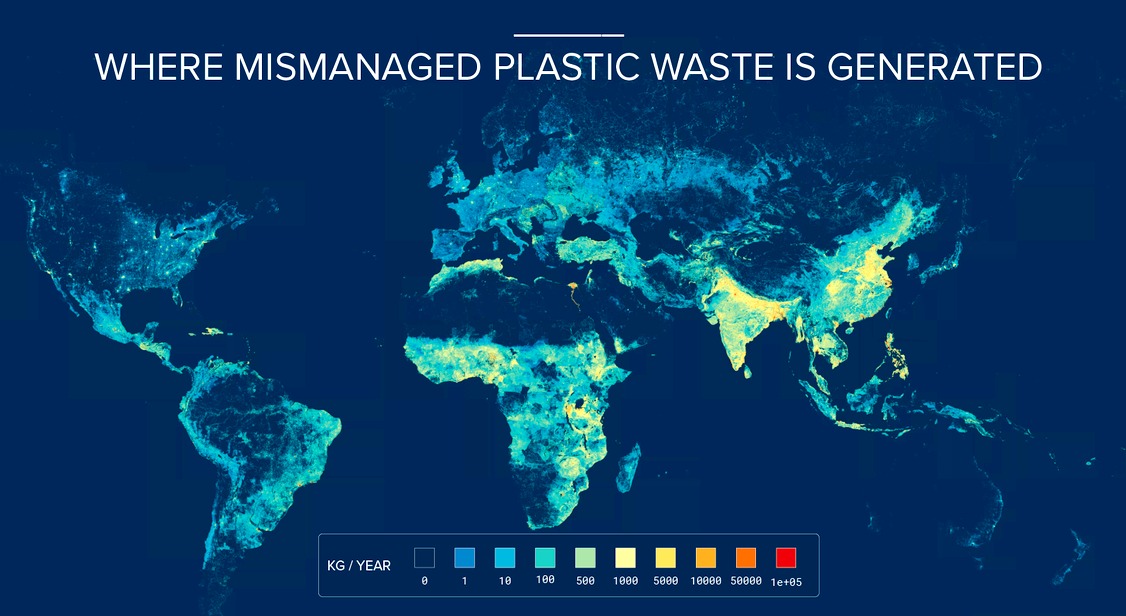
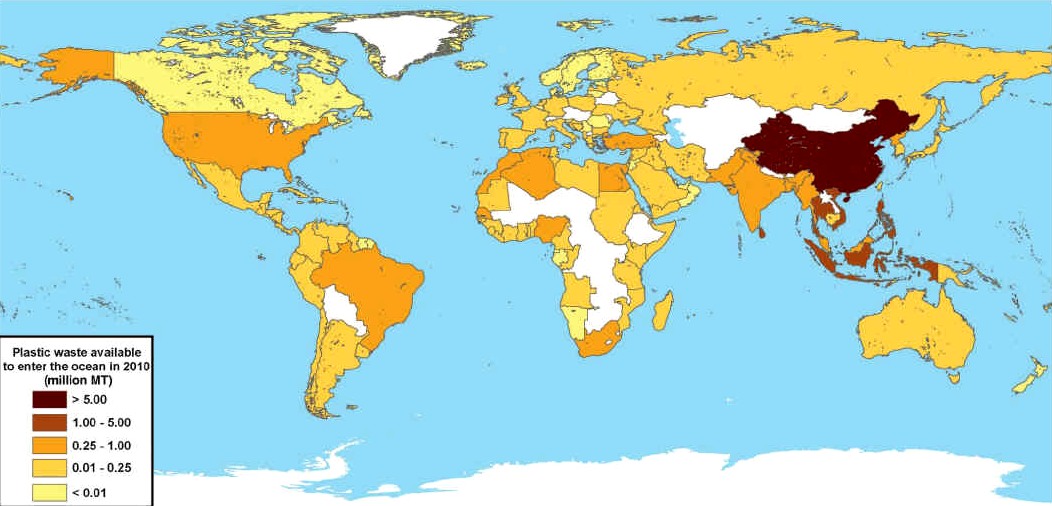
JENNA JAMBECK 2015 - Global map with each country shaded according to the estimated mass of mismanaged plastic waste [millions ofmetric tons (MT)] generated in 2010 by populations living within 50 km of the coast. 192 countries were considered. Countries not included in the study are shaded white.
PILOT MARINE LITTER PICKER - This machine is essentially a 16 meter version of the 44 meter SeaVax. It is the only design in the world capable of extracting micro plastics from rivers at the time of writing. In this diagram we are looking through the superstructure. We can see a boom ahead of the cleaning head on the right, guiding litter into the filtration head, where it is lifted up into the large storage chamber, then carried to a harbour for offloading. The vessel is designed to navigate itself to a designated location, with input from human operators as may be required, where a dockside treatment or container storage system allows speedy turnarounds. Copyright © diagrams 21 November 2019. All rights reserved, Cleaner Ocean Foundation Ltd.
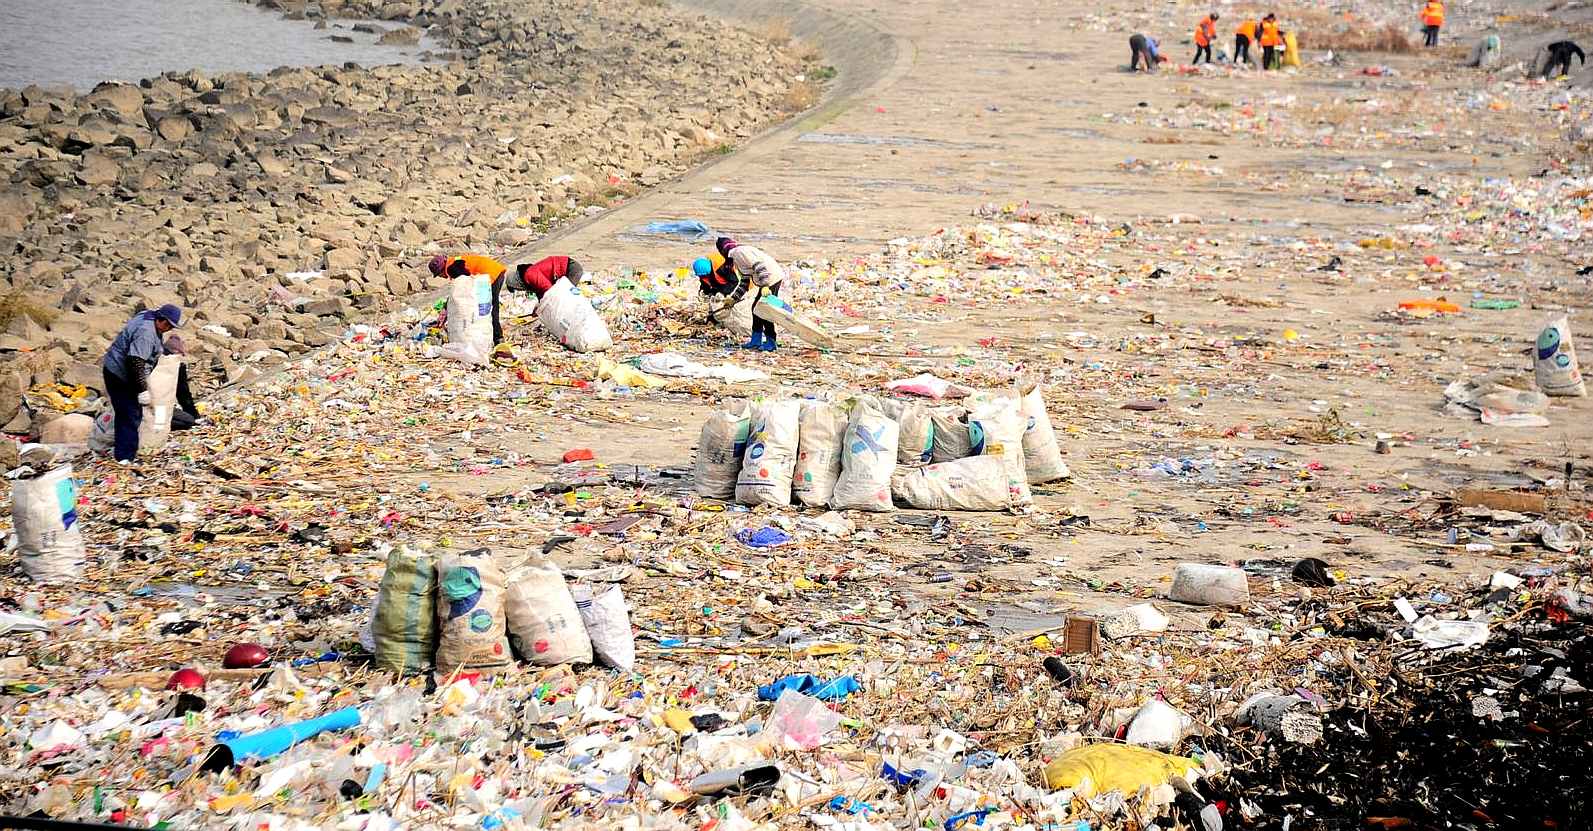
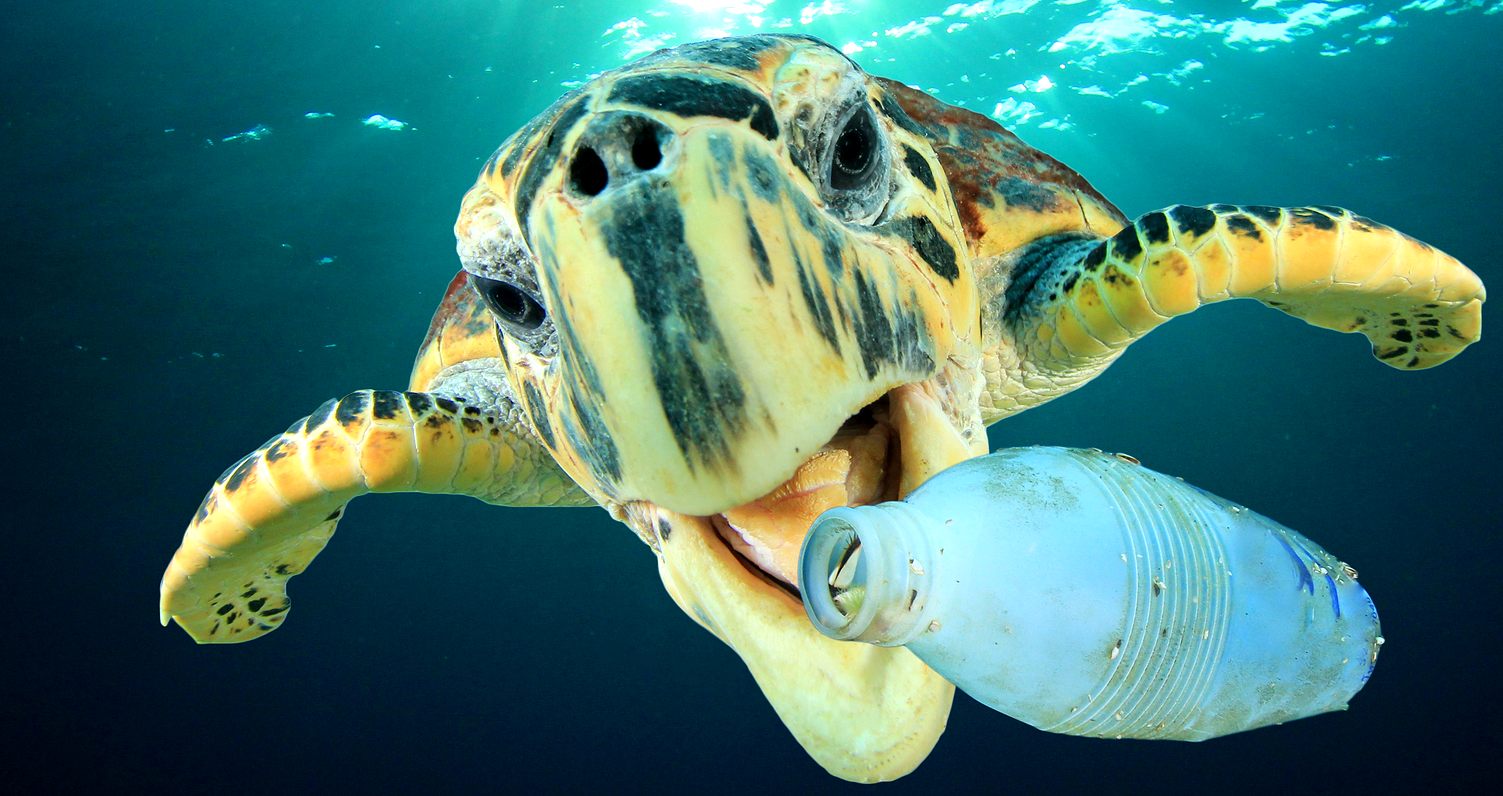
FAST FOOD SLOW RECOVERY - If we all work together we can significantly impact on scenes like this. We have been enjoying the benefits of plastic without ensuring that this durable medium does not unduly affect marine life. Unfortunately, retrospective measures will take longer to achieve equilibrium, but we must act now if we want to prevent more plastic than fish in the sea by 2050. Fortunately, many of the top producers are now looking at circularizing with a view to preventing ocean waste, such as the Alliance to End Plastic Waste.
LINKS & REFERENCE
https://www.nature.com/articles/ncomms15611#t1 https://cosmosmagazine.com/biology/just-10-rivers-to-blame-for-millions-of-tonnes-of-ocean-plastic https://news.sky.com/story/just-10-rivers-carry-90-of-plastic-polluting-the-oceans-11167581 https://thethaiger.com/thai-life/top-10-most-plastic-polluted-rivers-in-the-world-2019 https://earthbuddies.net/citarum-river-indonesia/
|
||||||||||||||||||||||||||||||||||||||||||||||||||||||||||||||||||||||||||||||||||||||||||||||||||||||||||||||||||||||||||||||||||||||||||||||||||||||||||||||||||||||||
|
AMAZON - AMUR - BRANTAS - BURIGANGA RIVER - CITARUM RIVER - CONGO - CROSS - DANUBE - DONG - CUYAHOGA - GANGA - GANGES - HAI HE -
HANJIANG - HUANGPU - IMO - INDUS - IRRAWADDY - IRTYSH - RIVER JORDAN - KWA IBO - LENA - MAGDELENA - RIVER MANTANZA-RIACHUELO
MARILAO - MEKONG - MISSISSIPPI RIVER - NIGER - THE RIVER NILE - PARANA - PASIG - PROGO - SARNO - SERAYU - SOLO - TAMSUI
THAMES - XI - YAMUNA - YANGTZE RIVER - YELLOW - ZHUJIANG PEARL
ABS - BIOMAGNIFICATION - CANCER - CARRIER BAGS - COTTON BUDS - DDT - FISHING NETS - HEAVY METALS - MARINE LITTER - MICROBEADS MICRO PLASTICS - NYLON - OCEAN GYRES - OCEAN WASTE - PACKAGING - PCBS - PET - PETROLEUM - PLASTIC - PLASTICS - POLYCARBONATE POLYOLEFINS - POLYPROPYLENE - POLYSTYRENE - POLYTHENE - POPS - PVC - SHOES - SINGLE USE - SOUP - STRAWS - WATER
PLEASE USE OUR A-Z INDEX TO NAVIGATE THIS SITE
|
||||||||||||||||||||||||||||||||||||||||||||||||||||||||||||||||||||||||||||||||||||||||||||||||||||||||||||||||||||||||||||||||||||||||||||||||||||||||||||||||||||||||
|
This website is provided on a free basis as a public information service. copyright © Cleaner Oceans Foundation Ltd (COFL) (Company No: 4674774) 2024. Solar Studios, BN271RF, United Kingdom. COFL is a company without share capital.
|