|
JENNA JAMBECK
PLEASE USE OUR A-Z INDEX TO NAVIGATE THIS SITE |
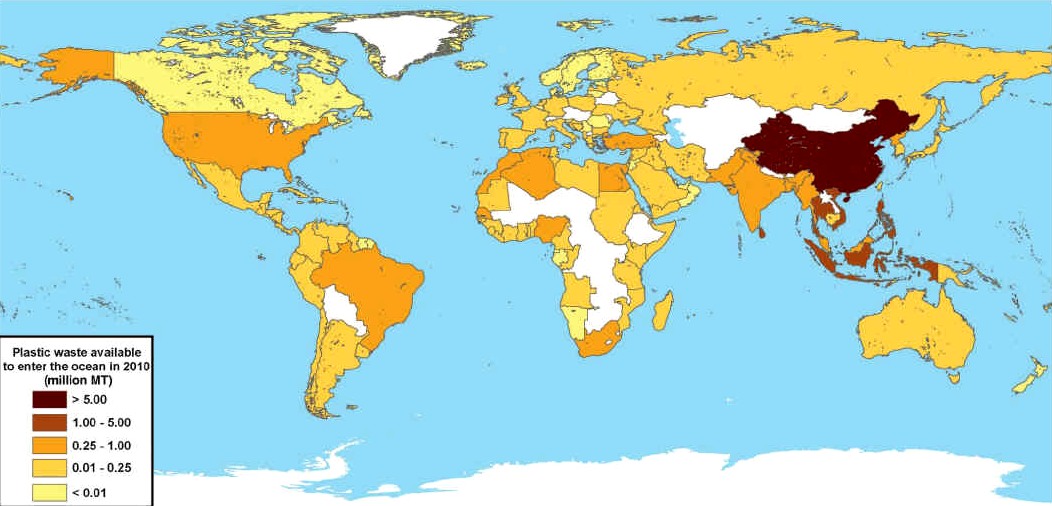
JAMBECK 2010 - Global map with each country shaded according to the estimated mass of mismanaged plastic waste [millions ofmetric tons (MT)] generated in 2010 by populations living within 50 km of the coast. 192 countries were considered. Countries not included in the study are shaded white.
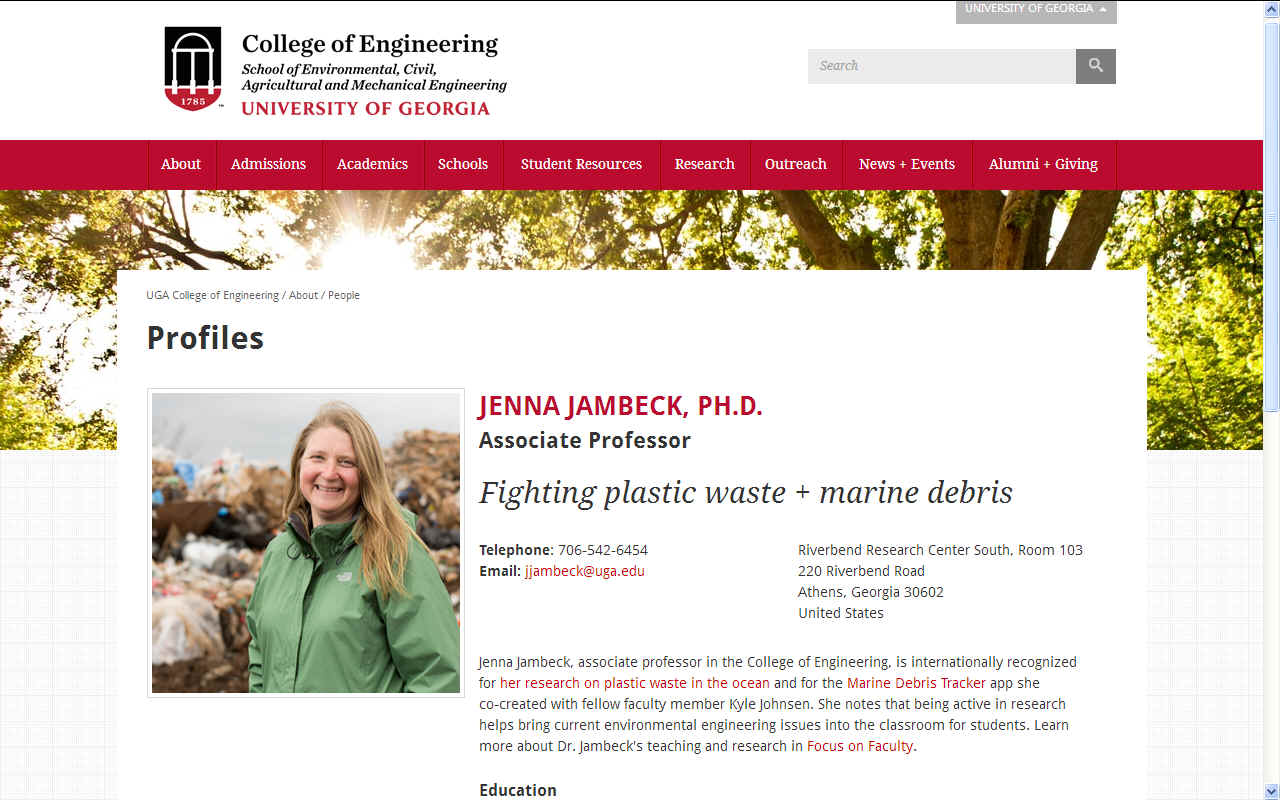
Jenna Jambeck is an award-winning explorer, associate professor, and director at the University of Georgia.
She has been conducting research on solid waste issues for over 20 years with related projects on marine debris since 2001.
She also specializes in global waste management issues and plastic contamination. Her work on plastic waste inputs into the ocean published in Science magazine has been recognized by the global community and translated into policy discussions by the Global Ocean Commission, in testimony to U.S. Congress, in G7 and G20 Declarations, and the United Nations Environment Programme.
Jenna conducts public environmental diplomacy as an International Informational Speaker for the U.S., including multiple global programs of speaking events, meetings, presentations to governmental bodies, and media outreach around the world.
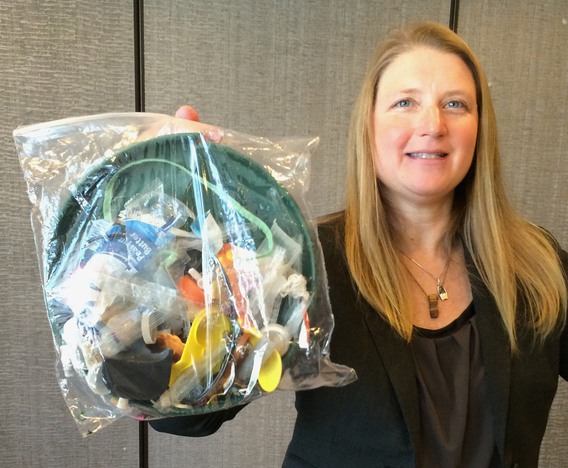
In 2014, Jenna sailed across the Atlantic Ocean with 13 other women in eXXpedition to sample land and open-ocean plastic and encourage women to enter STEM disciplines.
She is co-developer of the mobile app Marine Debris Tracker, a tool that continues to facilitate a growing global citizen science initiative that has documented the location of over 1 million litter and marine debris items removed from our environment throughout the world.
EDUCATION
Ph.D., Environmental Engineering Sciences, University of Florida, 2004
CONTACT JENNA
Telephone: 706-542-6454
JENNA R JAMBECK et al. - MARINE POLLUTION STUDY ON 2010 DATA PUB. 2015
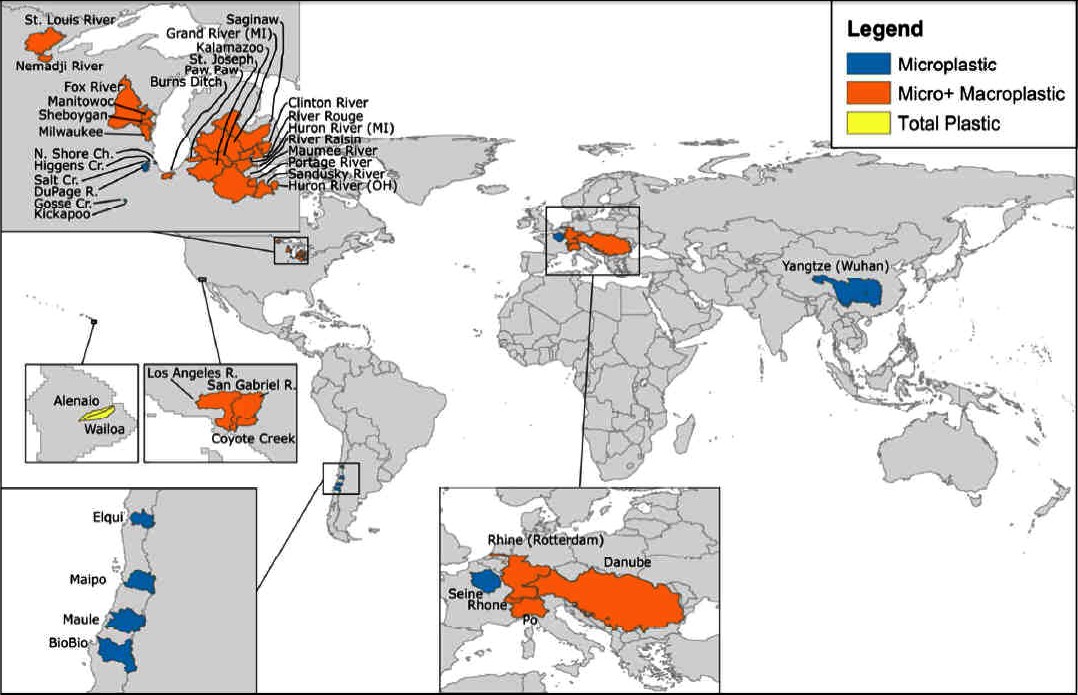
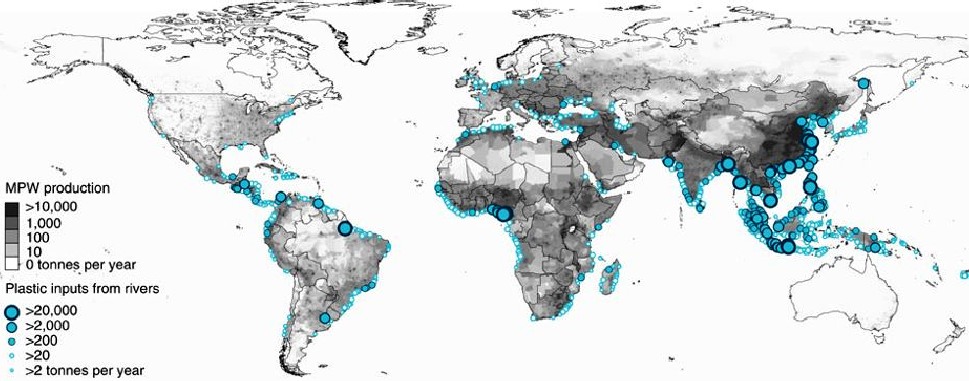
Estimates of the mass of plastic waste carried by particular waterways range from <<1 kg per day (Hilo, HI) to 4.2 MT (4200 kg) per day (Danube River) (10, 11). Because of their dependence on local
watershed characteristics, these results cannot be easily extrapolated to a global scale.
Long-term solutions will likely include waste reduction and “downstream” waste management strategies such as expanded recovery systems and extended producer responsibility.
AUTHORS:
Jenna R.
Jambeck, College of Engineering, College of Engineering, University of Georgia, 412 Driftmier
Roland Geyer, Bren School of Environmental Science and Management, University of California, Santa Barbara, CA 93106, USA.
Chris Wilcox, Oceans and Atmosphere Flagship, Commonwealth Scientific and Industrial Research Organization, Castray Esplanade, Hobart, Tasmania 7000, Australia.
Theodore R. Siegler, DSM Environmental Services, Windsor, VT 05089, USA.
Miriam Perryman, College of Engineering, University of Georgia, 412 Driftmier Engineering Center, Athens, GA 30602, USA.
Anthony Andrady, Department of Chemical and Biomolecular Engineering, North Carolina State University, Raleigh, NC 27695, USA.
Ramani Narayan, Department of Chemical Engineering and Materials Science, Michigan State University, East Lansing, MI 48824, USA.
Kara Lavender Law, Sea Education Association, Woods Hole, MA 02543, USA.
SCHMIDT OCT 2017 - A substantial fraction of marine plastic debris originates from land-based sources. Rivers potentially act as a major transport pathway for all sizes of plastic debris.
300 MILLION TONS
Every
year the world, produces 300 million tonnes of plastics, and 8.8 million tonnes of these are dumped into the oceans. That’s about 40 billion plastic
bottles, 100 billion single-use plastic bags, and 522 million personal care items.
Approximately 700 marine species are in danger of extinction because of plastic pollution.
If you know a seriously polluted river, or one that should be a candidate on a bigger list, please contact Cleaner Ocean Foundation.
The rivers noted, added to hundreds of other lesser contributors feed the five ocean gyres.
LEBRETON 2017 - Mass of river plastic flowing into oceans in tonnes per year. River contributions are derived from individual watershed characteristics such as population density, mismanaged plastic waste (MPW) production per country and monthly averaged runoff. The model is calibrated against river plastic concentration measurements from Europe, Asia, North and South America.
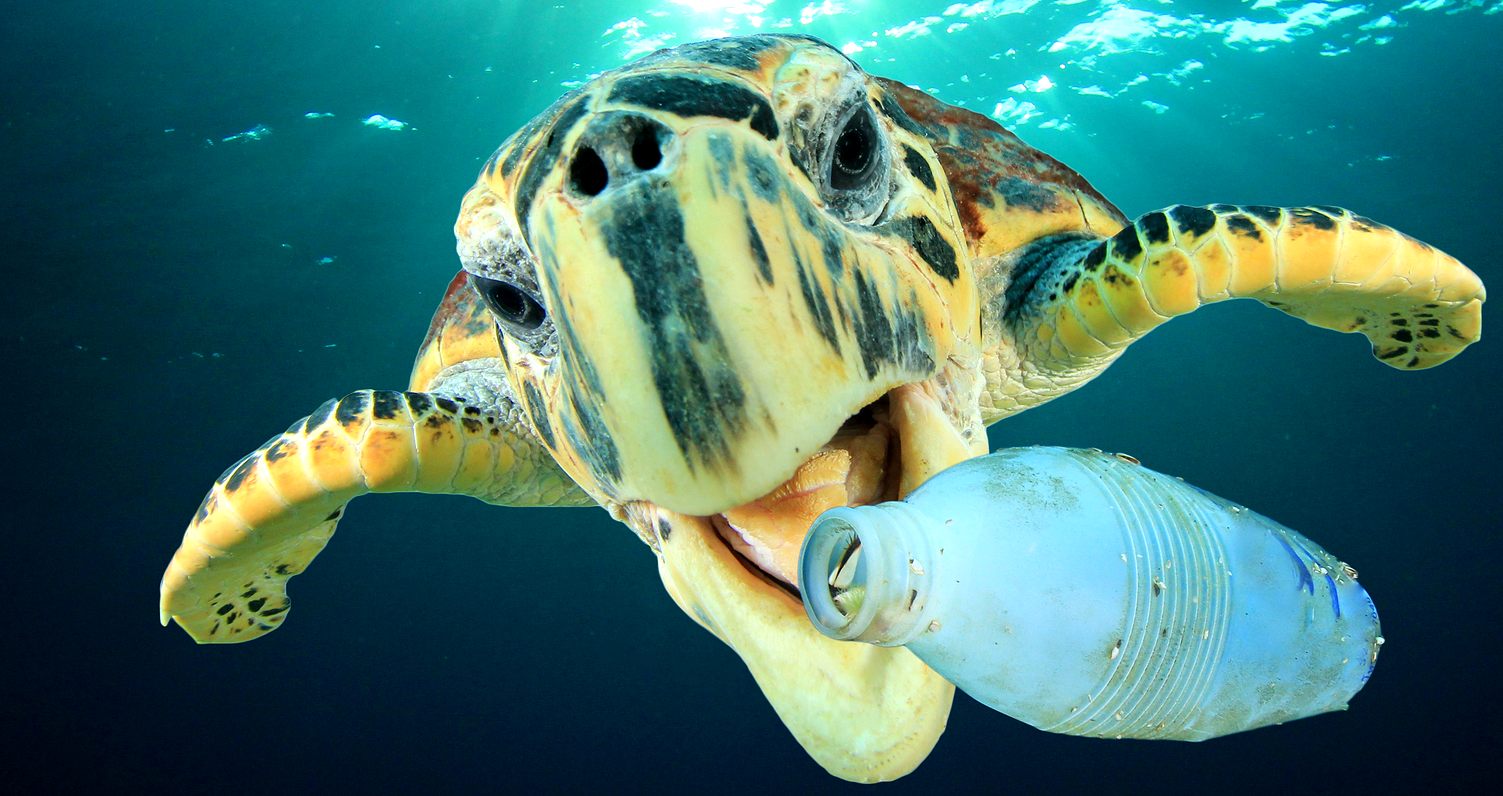
FAST FOOD SLOW RECOVERY - If we all work together we can significantly impact on scenes like this. We have been enjoying the benefits of plastic without ensuring that this durable medium does not unduly affect marine life. Unfortunately, retrospective measures will take longer to achieve equilibrium, but we must act now if we want to prevent more plastic than fish in the sea by 2050. Fortunately, many of the top producers are now looking at circularizing with a view to preventing ocean waste, such as the Alliance to End Plastic Waste.
LINKS & REFERENCE
http://jambeck.engr.uga.edu/ http://www.engineering.uga.edu/people/profile/jenna-jambeck-ph.d https://www.nationalgeographic.org/find-explorers/jenna-romness-jambeck
|
|
ABS - BIOMAGNIFICATION - CANCER - CARRIER BAGS - COTTON BUDS - DDT - FISHING NETS - HEAVY METALS - MARINE LITTER - MICROBEADS MICRO PLASTICS - NYLON - OCEAN GYRES - OCEAN WASTE - PACKAGING - PCBS - PET - PETROLEUM - PLASTIC - PLASTICS - POLYCARBONATE POLYOLEFINS - POLYPROPYLENE - POLYSTYRENE - POLYTHENE - POPS - PVC - SHOES - SINGLE USE - SOUP - STRAWS - WATER
PLEASE USE OUR A-Z INDEX TO NAVIGATE THIS SITE
|
|
This website is provided on a free basis as a public information service. copyright © Cleaner Oceans Foundation Ltd (COFL) (Company No: 4674774) 2019. Solar Studios, BN271RF, United Kingdom. COFL is a company without share capital.
|