|
BUILD
UP
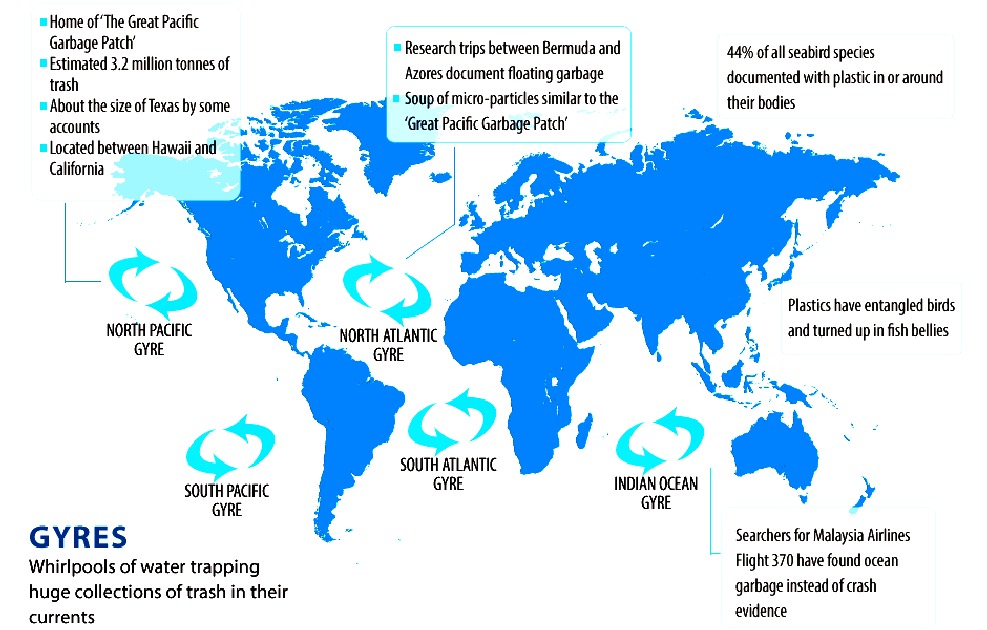
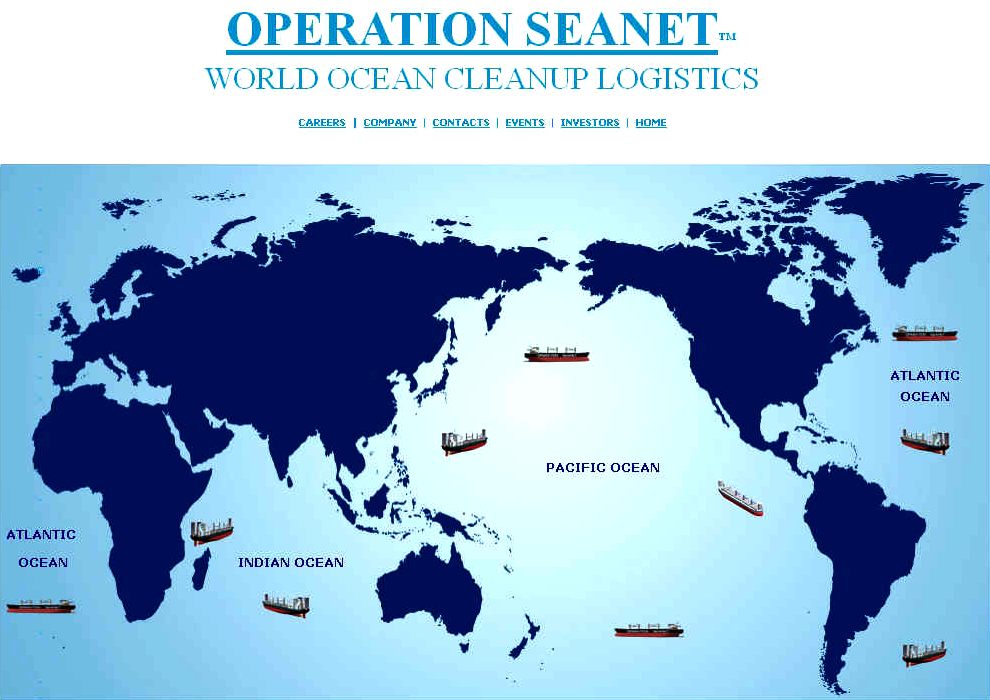
- Plastic has accumulated in five ocean hot spots called
gyres, seen here in this world map derived from information
published by 5 Gyres.
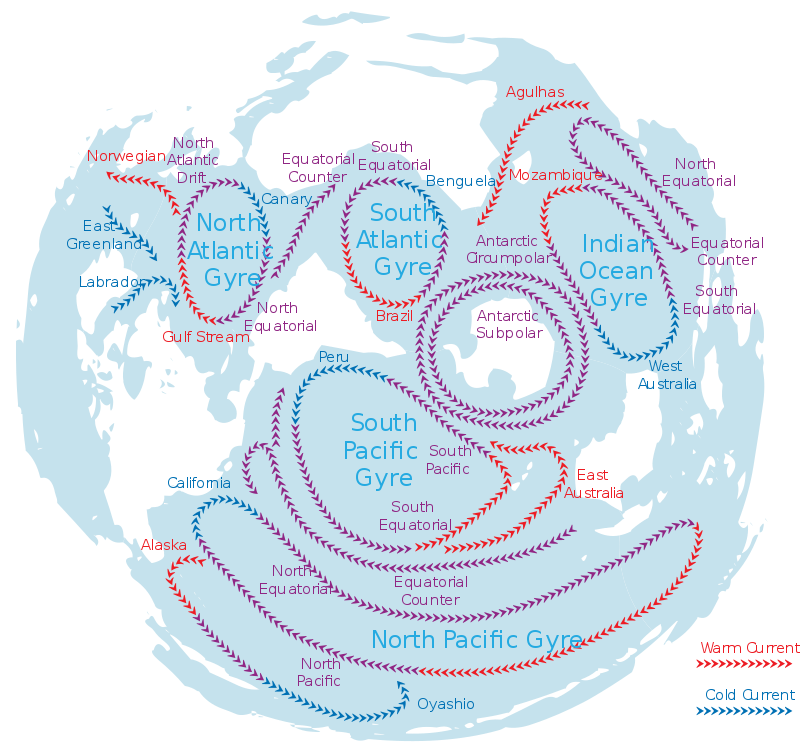
The movement of the world�s major ocean gyres helps drive the �ocean conveyor belt.� The ocean conveyor belt circulates ocean water around the entire
planet, making this an international problem.
It is estimated that 1.15 to 2.41 million tonnes of plastic are entering the
North Pacific ocean each year from rivers. More than half of this plastic is less dense than the water, meaning that it will not sink once it encounters the sea.
The stronger, more buoyant plastics show resiliency in the marine environment, allowing them to be transported over extended distances. They persist at the sea surface as they make their way offshore, transported by converging currents and finally accumulating in the patch.
Once these plastics enter the gyre, they are unlikely to leave the area until they degrade into smaller microplastics under the effects of sun, waves and marine life. As more and more plastics are discarded into the environment, microplastic concentration in the
Great Pacific Garbage Patch will
continue to increase.
THERE'S
MORE
There
are 5 major swirling ocean garbage patches called
gyres and
another in the Arctic ocean.
Garbage patches generally accumulate far from any country�s coastline, and it is nearly impossible to track the origin of marine debris. The tiny plastic particles that make up most of the patches are also very difficult and expensive to detect and remove.
1.
North Atlantic Gyre 2.
South Atlantic Gyre 3.
Indian Ocean Gyre 4.
North Pacific Gyre 5.
South Pacific Gyre
6.
Arctic
Ocean Gyre
To date no nation has accepted responsibility for cleaning up the ocean�s garbage
patches to the extent that they will agree to fund ocean cleaning up operations.
Such Agreement could allow a commercial approach for such projects as SeaVax
to venture capitalists.
It
is estimated that fleets of SeaVax vessels could recover much of the plastic
entering our oceans each year, and with more vessels operating, even begin
to clean up the gyres where plastic is more concentrated. This represents a
potential solution that the world powers are looking for.
On
land, the G20 have agreed to work to reduce single use plastic
in the hope
of slowing build up in the ocean, unfortunately this plan leaves plastic in our
oceans to alter marine ecology, kill seabirds, contaminate fish
and kill marine mammals.
The
G7
have created a fund for academics and innovation competitions looking for
ways to tackle ocean plastic waste. The Cleaner
Ocean Foundation does not qualify for such funding where these baits
assume corporate trading and profits from which to carve an R&D budget,
leaving SeaVax
and RiverVax
development out in the cold when run by a not for profit organization with charitable
objects as at present.
The
Foundation does not qualify for registration according to the UK Charity
Commission, despite acknowledgement of societal good works. This leaves donations
and crowdfunding
as our last hope unless governments are prepared to award paying contracts.
It is doubtful that could ever happen.
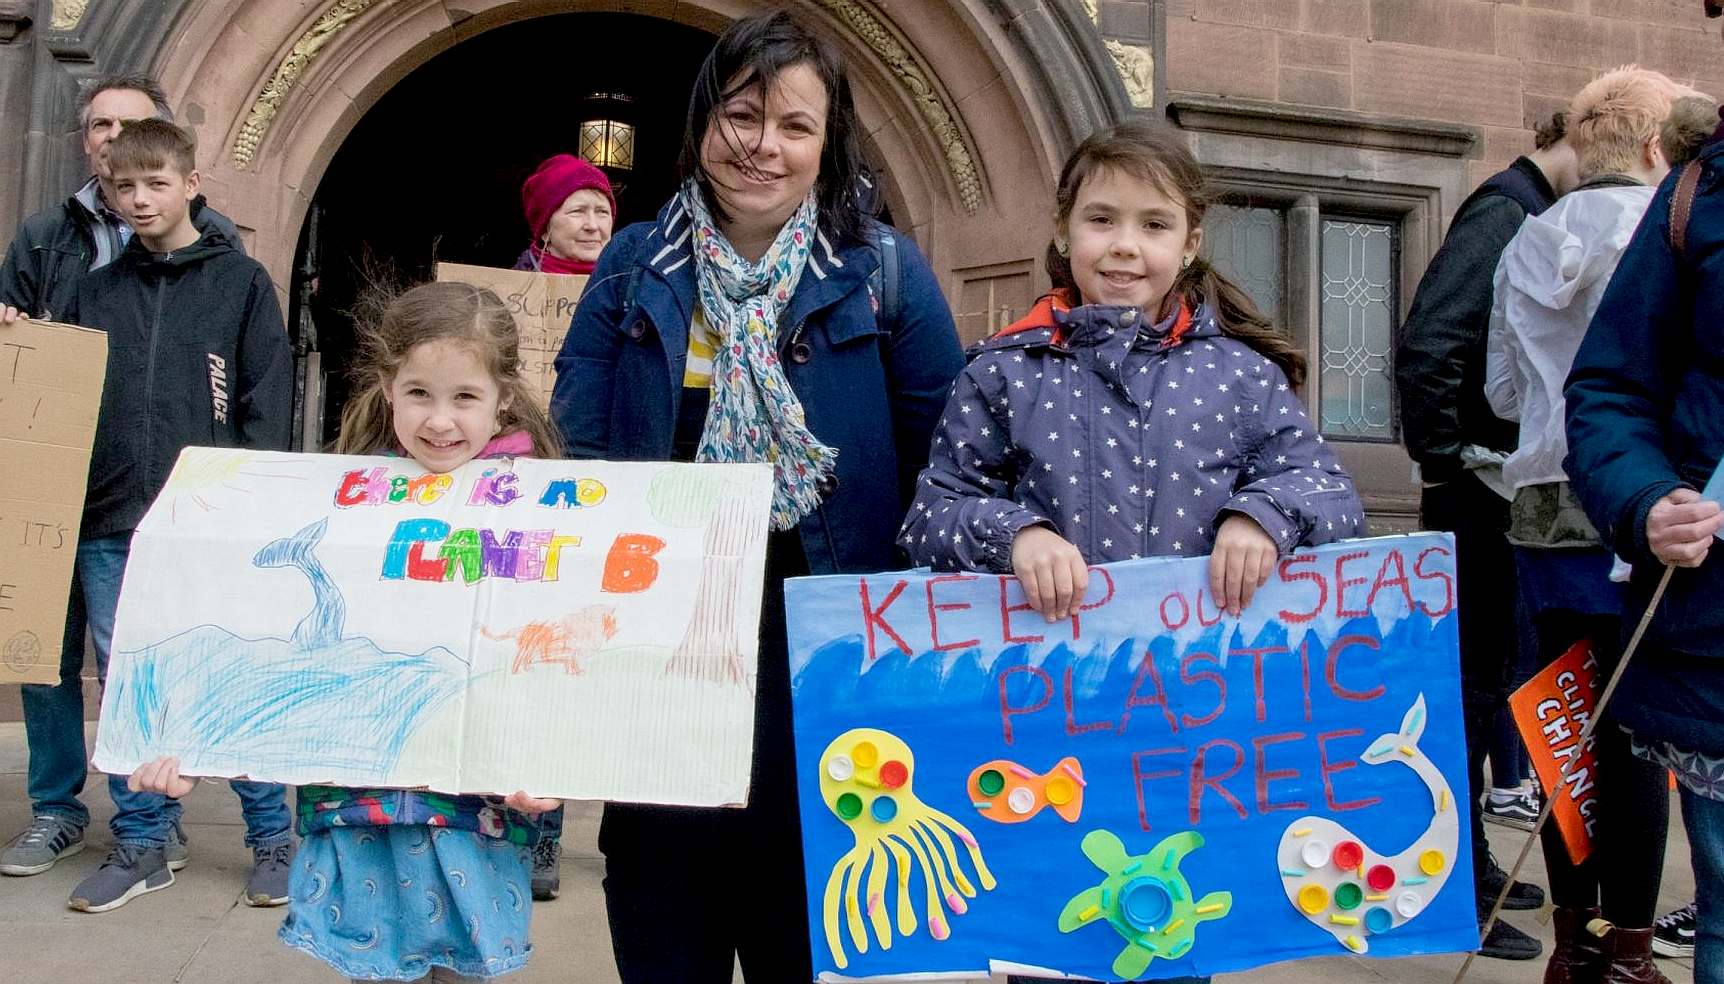
PROTESTS
- One way of drawing attention
to a social problem like marine litter is to peacefully demonstrate with
signs like this that say it all. By keeping the subject live in the minds of
politicians, eventually they will be forced into acting responsibly.
ABOUT
THE NPG
The North Pacific Gyre (NPG) or North Pacific Subtropical Gyre (NPSG), located in the northern Pacific Ocean, is one of the five major oceanic gyres. This gyre covers most of the northern Pacific Ocean. It is the largest ecosystem on Earth, located between the equator and 50� N latitude, and comprising 20 million square kilometers. The gyre has a clockwise circular pattern and is formed by four prevailing ocean currents: the North Pacific Current to the north, the California Current to the east, the North Equatorial Current to the south, and the Kuroshio Current to the west. It is the site of an unusually intense collection of man-made marine debris, known as the Great Pacific Garbage Patch.
The North Pacific Subtropical Gyre and the much smaller North Pacific Subpolar Gyre make up the two major gyre systems in the mid-latitudes of the Northern Pacific Ocean. This two-gyre circulation in the North Pacific is driven by the trade and westerly winds. This is one of the best examples of all of Earth�s oceans where these winds drive a two-gyre circulation. Physical characteristics like weak thermohaline circulation in the North Pacific and it is mostly blocked by land in the north, also help facilitate this circulation. As depth increases, these gyres in the North Pacific grow smaller and weaker, and the high pressure at the center of the Subtropical Gyre will migrate poleward and westward.
PHYSICAL GEOGRAPHY
Subtropical circulation in the North Pacific
Like all subtropical gyre systems, the North Pacific Subtropical Gyre is an anticyclone meaning the circulation is in a clockwise direction around its high pressure at the center because of its placement in the Northern Hemisphere. This circulation is also associated with equatorward Sverdrup transport and Ekman downwelling. Ekman transport causes water to flow toward the center of the gyre, creating a sloped sea-surface, and initiating geostrophic flow. Harald Sverdrup applied Ekman transport while including pressure gradient forces to develop a theory for Sverdrup transport.
The Kuroshio Current is the narrow, strong westward boundary current of the subtropical circulation. This current influences the water column all the way to the bottom. The Kuroshio current flows in a northerly direction, then eventually flows further from the westward boundary where it then takes an eastward direction into the North Pacific. This eastward flowing current is then called the Kuroshio Extension. The North Pacific Current is located just north of the Subtropical Gyre and flows in an easterly direction. Also, known as the West Wind Drift or the Subarctic Current, the North Pacific Current also includes the westward flow of the southern boundary of the North Pacific Subpolar Gyre. The North Equatorial Current borders the North Pacific Subtropical Gyre on the south and flows in a westerly direction. The westward flow within the elongated tropical cyclonic circulation is also included in the North Equatorial current. The California Current System comprises the eastern boundary of the North Pacific Subtropical Gyre and flows south along the coast of California. Here coastal upwelling drives the eastern boundary current and an undercurrent that flows poleward.
In the western region of the North Pacific, the surface of the Subtropical Gyre generally has a "C-shape". The Kuroshio current and Kuroshio Extension roughly from the outside of this "C-shape" where it then turns westwards into recirculation, where it then flows south parallel to the Kuroshio Current. From here the "C-shape" then flows eastward comprising the Subtropical Countercurrent at roughly 20 � 25⁰N, then finally the "C" wraps back towards the west forming the North Equatorial Current just south of 20⁰N. It is common for subtropical gyres to have this "C-shape" surface flow. The Subtropical Countercurrent is a shallow area of this "C"; at only about 250 dbar under the surface, circulation is a simpler closed, anticyclonic gyre.
Narrow east-west frontal zones that cross the Pacific are less than 100 km wide. The Subarctic Frontal Zone or Subarctic Boundary, about 42⁰N, is fixed in the North Pacific Current. The Subarctic Frontal Zone, slightly south of the maximum westerly wind speeds, separates the North Pacific Subpolar Gyre from the Subtropical Gyre. In the central and eastern Pacific at roughly 32⁰N is the Subtropical Frontal Zone. Sometimes referred to as the Subtropical Convergence Zone, this frontal zone serves as the boundary between the west flowing North Equatorial Current from the North Pacific Current. With increasing depth in the North Pacific Subtropical Gyre, it gets smaller in the western region near Japan and it also loses strength. The Subtropical Gyre does not exist below 1500 m below the surface with the exception of the Kuroshio Current and Extension regions.
Circulation dependence on depth
The North Pacific Subtropical Gyre diminishes spatially with increasing depth. Similar to all subtropical gyre systems, the North Pacific Subtropical Gyre shrinks towards its most energetic surface flows, in a northwestern direction between the Kuroshio Current and the Kuroshio Extension. This is drastic shrinkage from the surface to about 200 m below. At the surface, the boundary that separates the westward and eastward flows from south of 20⁰N to about 25 � 30⁰N at 200 m. The "C-shape" in the western region of the Subtropical Gyre, including the Subtropical Countercurrent, generally does not exist below 200 m. At about 1000 � 1500 m, the Subtropical Gyre is located entirely in the western region of the North Pacific near the Kuroshio Current and Kuroshio Extension. In the subtropical regions, flow is weak where influences from the Subtropical Gyre are minimal. Differences in steric heights over distances of 1000 km are on the order of 1 cm, rather than the differences of 10 cm within the area of the North Pacific Subtropical Gyre.
HISTORY
The patch was described in a 1988 paper published by the National Oceanic and Atmospheric Administration (NOAA). The description was based on research by several Alaska-based researchers in 1988 who measured neustonic plastic in the North Pacific Ocean. Researchers found relatively high concentrations of marine debris accumulating in regions governed by ocean currents. Extrapolating from findings in the Sea of Korea, the researchers hypothesized that similar conditions would occur in other parts of the Pacific where prevailing currents were favorable to the creation of relatively stable waters. They specifically indicated the North Pacific Gyre.
Charles J.
Moore, returning home through the North Pacific Gyre after competing in the Transpacific Yacht Race in 1997, claimed to have come upon an enormous stretch of floating debris. Moore alerted the oceanographer Curtis Ebbesmeyer, who subsequently dubbed the region the "Eastern Garbage Patch" (EGP). The area is frequently featured in media reports as an exceptional example of marine pollution.
The JUNK Raft Project was a 2008 trans-Pacific sailing voyage made to highlight the plastic in the patch, organized by the Algalita Marine Research Foundation.
In 2009, two project vessels from Project Kaisei, the New Horizon and the Kaisei, embarked on a voyage to research the patch and determine the feasibility of commercial scale collection and recycling. The 2009 SEAPLEX expedition also researched the patch. Researchers were also looking at the impact of plastic on mesopelagic fish, such as lanternfish.
At TEDxDelft2012, Boyan Slat unveiled a concept for removing large amounts of marine debris from oceanic gyres. Calling his project The Ocean Cleanup, he proposed to use surface currents to let debris drift to collection platforms. Operating costs would be relatively modest and the operation would be so efficient that it might even be profitable. The concept makes use of floating booms that divert rather than catch the debris. This avoids bycatch, while collecting even the smallest particles. According to Slat's calculations, a gyre could be cleaned up in five years' time, amounting to at least 7.25 million tons of plastic across all gyres. He also advocated "radical plastic pollution prevention methods" to prevent gyres from reforming. In 2015, The Ocean Cleanup project was a category winner in the Design Museum's 2015 Designs of the Year awards. A fleet of 30 vessels, including a 32-metre (105-foot) mothership, took part in a month-long voyage to determine how much plastic is present using trawls and aerial surveys.
The 2012 Algalita/5 Gyres Asia Pacific Expedition began in the Marshall Islands on 1 May, investigated the patch, collecting samples for the 5 Gyres Institute, Algalita Marine Research Foundation and several other institutions, including NOAA, Scripps, IPRC and Woods Hole Oceanographic Institute. In 2012, the Sea Education Association (SEA) conducted research expeditions in the gyre. 118 net tows were conducted and nearly 70,000 pieces of plastic were counted.
In 2012, researchers Goldstein, Rosenberg and Cheng found that microplastic concentrations in the gyre had increased by two orders of magnitude in the prior four decades.
On 11 April 2013, artist Maria Cristina Finucci founded The Garbage Patch State at
UNESCO - Paris in front of Director General Irina Bokova.
In 2015, a study published in the journal Science sought to discover where exactly all of this garbage is coming from. According to the researchers, the discarded plastics and other debris floats eastward out of countries in Asia from six primary sources: China, Indonesia, the Philippines, Vietnam, Sri Lanka and Thailand.
On 9 September 2018, the first collection system was deployed to the gyre to begin the collection task. This initial trial run of the Ocean Cleanup Project started towing its "Ocean Cleanup System 001" from San Francisco to a trial site some 240 nautical miles (260 miles) away.
CONSTITUTION
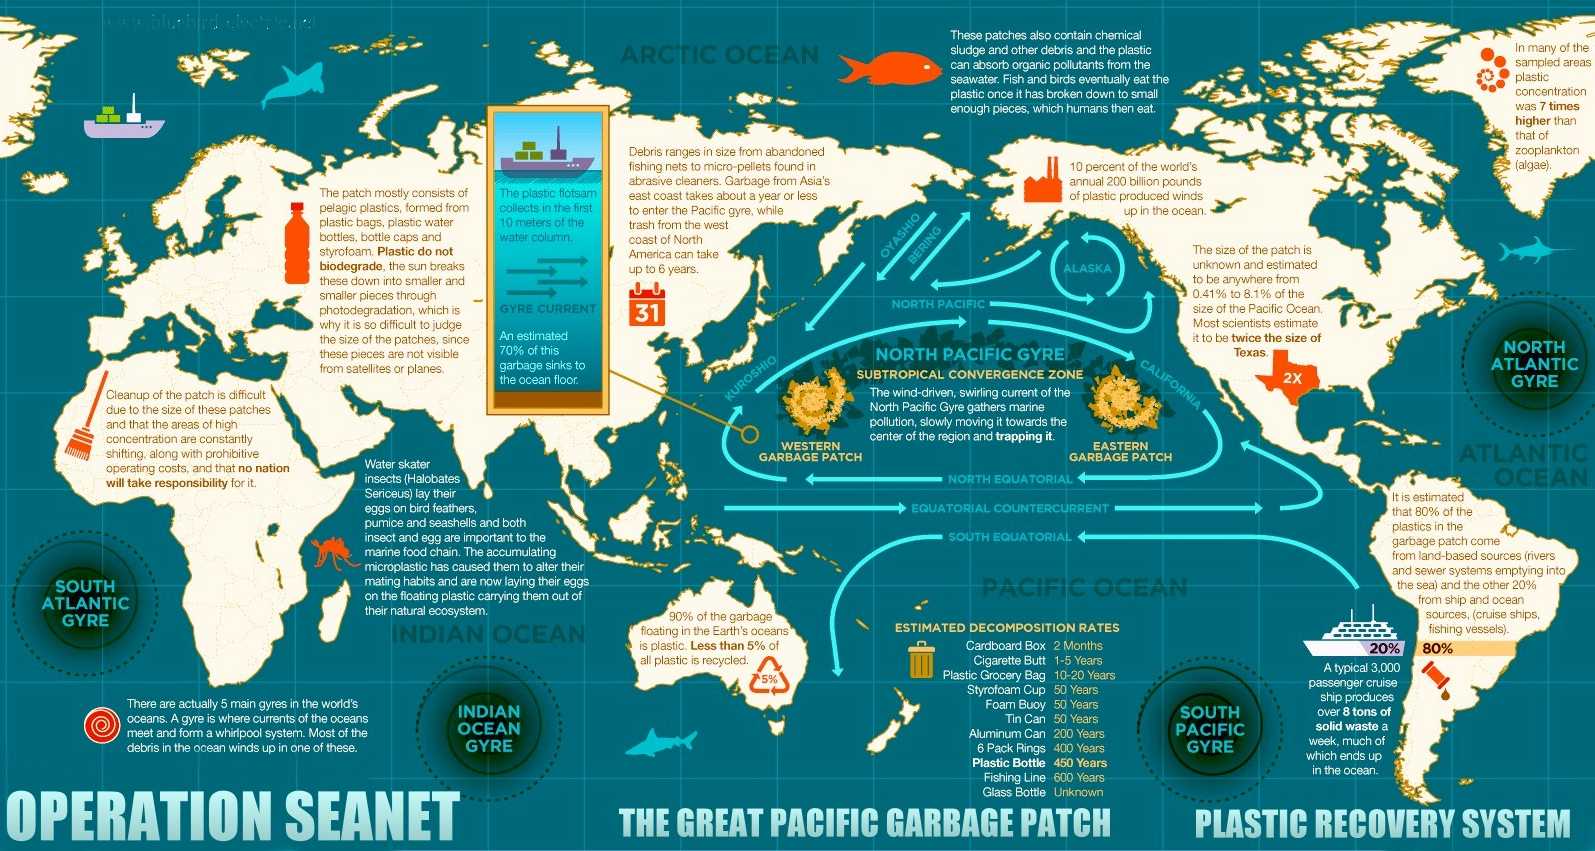
The Great Pacific garbage patch formed gradually as a result of ocean or marine pollution gathered by ocean currents. It occupies a relatively stationary region of the North Pacific Ocean bounded by the North Pacific Gyre in the horse latitudes. The gyre's rotational pattern draws in waste material from across the North Pacific, including coastal waters off North America and Japan. As material is captured in the currents, wind-driven surface currents gradually move debris toward the center, trapping it.
No strong scientific data concerning the origins of pelagic plastics exists. In a 2014 study researchers sampled 1571 locations throughout the world's oceans, and determined that discarded fishing gear such as buoys, lines and nets accounted for more than 60% of the mass of plastic marine debris. According to a 2011 EPA report, "The primary source of marine debris is the improper waste disposal or management of trash and manufacturing products, including plastics (e.g., littering, illegal dumping) ... Debris is generated on land at marinas, ports, rivers, harbors, docks, and storm drains. Debris is generated at sea from fishing vessels, stationary platforms, and cargo ships." Constituents range in size from miles-long abandoned fishing nets to micro-pellets used in cosmetics and abrasive cleaners. Currents carry debris from the west coast of North America to the gyre in about six years, and from the east coast of Asia in a year or less.
A 2017 study concluded that of the 9.1 billion tons of plastic produced since 1950, close to 7 billion tons are no longer in use. The authors estimate that 9% was recycled, 12% was incinerated, and the remaining 5.5 billion tons remains in the oceans and land.
SIZE ESTIMATE
The size of the patch is indefinite, as is the precise distribution of debris, because large items are
uncommon. Most debris consists of small plastic particles suspended at or just below the surface, evading detection by aircraft or satellite. Instead, the size of the patch is determined by sampling. Estimates of size range from 700,000 square kilometres (270,000 sq mi) (about the size of Texas) to more than 15,000,000 square kilometres (5,800,000 sq mi) (about the size of Russia). Such estimates, however, are conjectural given the complexities of sampling and the need to assess findings against other areas. Further, although the size of the patch is determined by a higher-than-normal degree of concentration of pelagic debris, there is no standard for determining the boundary between "normal" and "elevated" levels of pollutants to provide a firm estimate of the affected area.
Net-based surveys are less subjective than direct observations but are limited regarding the area that can be sampled (net apertures 1�2 m and ships typically have to slow down to deploy nets, requiring dedicated ship's time). The plastic debris sampled is determined by net mesh size, with similar mesh sizes required to make meaningful comparisons among studies. Floating debris typically is sampled with a neuston or manta trawl net lined with 0.33 mm mesh. Given the very high level of spatial clumping in marine litter, large numbers of net tows are required to adequately characterize the average abundance of litter at sea. Long-term changes in plastic meso-litter have been reported using surface net tows: in the North Pacific Subtropical Gyre in 1999, plastic abundance was 335,000 items/km2 and 5.1 kg/km2, roughly an order of magnitude greater than samples collected in the 1980s. Similar dramatic increases in plastic debris have been reported off Japan. However, caution is needed in interpreting such findings, because of the problems of extreme spatial heterogeneity, and the need to compare samples from equivalent water masses, which is to say that, if an examination of the same parcel of water a week apart is conducted, an order of magnitude change in plastic concentration could be observed.
� Ryan et al
In August 2009, the Scripps Institution of Oceanography/Project Kaisei SEAPLEX survey mission of the Gyre found that plastic debris was present in 100 consecutive samples taken at varying depths and net sizes along a path of 1,700 miles (2,700 km) through the patch. The survey found that, although the patch contains large pieces, it is on the whole made up of smaller items that increase in concentration toward the gyre's centre, and these 'confetti-like' pieces that are visible just beneath the surface suggests the affected area may be much smaller. 2009 data collected from Pacific albatross populations suggest the presence of two distinct debris zones.
In March 2018, The Ocean Cleanup published a paper summarizing their findings from the Mega- (2015) and Aerial Expedition (2016). In 2015, the organization crossed the Great Pacific garbage patch with 30 vessels, to make observations and take samples with 652 survey nets. They collected a total of 1.2 million pieces, which they counted and categorized into their respective size classes. In order to also account for the larger, but more rare larger debris, they also overflew the patch in 2016 with a C-130 Hercules aircraft, equipped with LiDAR sensors. The findings from the two expeditions, found that the patch covers 1.6 million square kilometers with a concentration of 10�100 kg per square kilometer. They estimate an 80,000 metric tons in the patch, with 1.8 trillion plastic pieces, out of which 92% of the mass is to be found in objects larger than 0.5 centimeters.
NOAA stated:
While "Great Pacific Garbage Patch" is a term often used by the media, it does not paint an accurate picture of the marine debris problem in the North Pacific Ocean. The name "Pacific Garbage Patch" has led many to believe that this area is a large and continuous patch of easily visible marine debris items such as bottles and other litter�akin to a literal island of trash that should be visible with satellite or aerial photographs. This is not the case.
� Ocean Facts, National Ocean Service
PHOTO DEGRADATION OF PLASTICS
The patch is one of several oceanic regions where researchers have studied the effects and impact of plastic photodegradation in the neustonic layer of water. Unlike organic debris, which biodegrades, plastic disintegrates into ever smaller pieces while remaining a polymer (without changing chemically). This process continues down to the molecular level. Some plastics decompose within a year of entering the water, releasing potentially toxic chemicals such as bisphenol A, PCBs and derivatives of polystyrene. As the plastic flotsam photodegrades into smaller and smaller pieces, it concentrates in the upper water column. As it disintegrates, the pieces become small enough to be ingested by aquatic organisms that reside near the ocean's surface. Plastic may become concentrated in neuston, thereby entering the food chain.
Disintegration means that much of the plastic is too small to be seen. In a 2001 study, researchers found concentrations of plastic particles at 334,721 pieces per km2 with a mean mass of 5.1 kg (11.3 lbs) per km2, in the neuston. The overall concentration of plastics was seven times greater than the concentration of
zooplankton in many of the sampled areas. Samples collected deeper in the water column found much lower concentrations of plastic particles (primarily monofilament fishing line pieces).
EFFECT ON MARINE LIFE & HUMANS
The United Nations Ocean Conference estimated that the oceans might contain more weight in plastics than fish by the year 2050. Some long-lasting plastics end up in the stomachs of marine animals. Plastic attracts seabirds and fish. When marine life consumes plastic allowing it to enter the food chain, this can lead to greater problems when species that have consumed plastic are then eaten by other predators.
Animals can also become trapped in plastic nets and rings, which can cause death. Sea turtles are most affected by this. Cetaceans have been sighted within the patch, which poses entanglement and ingestion risks to animals using the Great Pacific garbage patch as a migration corridor or core habitat.
Affected species include sea turtles and the black-footed albatross. Midway Atoll receives substantial amounts of marine debris from the patch.
Direct harm to species
Of the 1.5 million Laysan albatrosses that inhabit Midway Atoll, nearly all are likely to have plastic in their gastrointestinal tract. Approximately one-third of their chicks die, and many of those deaths are from plastic unwittingly fed to them by their parents. Twenty tons of plastic debris washes up on Midway every year with five tons ending up in the bellies of albatross chicks. Fish and whales may also mistake the plastic as a food source.
Indirect harm via the food chain
On the microscopic level, debris can absorb organic pollutants from seawater, including PCBs, DDT and PAHs. Aside from toxic effects, some of these are mistaken by the endocrine system as estradiol, disrupting hormone levels in affected animals. These toxin-containing plastic pieces are also eaten by jellyfish, which are then eaten by fish and then by humans.
Spreading invasive species
Marine plastics facilitate the spread of invasive species that attach to floating plastic in one region and drift long distances to colonize other ecosystems. Debris affects at least 267 species worldwide.
Increasing microplastic concentrations has released the insect Halobates sericeus from substrate limitation. A positive correlation between H. sericeus and microplastic was observed, along with increasing H. sericeus egg densities.
LINKS
& REFERENCES
See
the relevant sections below for specific references concerning the discovery
and history of the patch. A general overview is provided in Dautel, Susan L.
"Transoceanic Trash: International and United States Strategies for the
Great Pacific Garbage Patch", 3 Golden Gate U. Envtl. L.J. 181 (2007)
"World's
largest collection of ocean garbage is twice the size of Texas". USA
TODAY. Retrieved 29
April 2018.
For
this and what follows, see Moore (2004) and Moore (2009), which includes
photographs taken from the patch,
www.theoceancleanup.com,
The Ocean Cleanup. "The
Great Pacific Garbage Patch � The Ocean Cleanup". The Ocean
Cleanup. Retrieved 8
May 2018.
Lebreton,
L.; Slat, B.; Ferrari, F.; Sainte-Rose, B.; Aitken, J.; Marthouse, R.;
Hajbane, S.; Cunsolo, S.; Schwarz, A. (22 March 2018). "Evidence
that the Great Pacific Garbage Patch is rapidly accumulating plastic".
Scientific Reports. 8 (1): 4666. Bibcode:2018NatSR...8.4666L.
doi:10.1038/s41598-018-22939-w.
ISSN 2045-2322.
PMC 5864935.
PMID 29568057.
Lovett,
Richard A. (2 March 2010). "Huge
Garbage Patch Found in Atlantic Too". National Geographic News.
National
Geographic Society.
Victoria
Gill (24 February 2010). "Plastic
rubbish blights Atlantic Ocean". BBC.
Retrieved 16 March 2010.
Day,
Robert H.; Shaw, David G.; Ignell, Steven E. (1988). "The
Quantitative Distribution and Characteristics of Neuston Plastic in the
North Pacific Ocean, 1985-88. (Final Report to U.S. Department of Commerce,
National Marine Fisheries Service, Auke Bay Laboratory. Auke Bay,
Alaska)" (PDF). pp. 247�266.
"After
entering the ocean, however, neuston plastic is redistributed by currents
and winds. For example, plastic entering the ocean in Korea is moved
eastward by the Subarctic Current (in Subarctic Water) and the Kuroshio (in
Transitional Water, Kawai 1972; Favorite et al. 1976; Nagata et al. 1986).
In this way, the plastic is transported from high-density areas to
low-density areas. In addition to this eastward movement, Ekman stress from
winds tends to move surface waters from the subarctic and the subtropics
toward the Transitional Water mass as a whole (see Roden 1970: fig. 5).
Because of the convergent nature of this Ekman flow, densities tend to be
high in Transitional Water. In addition, the generally convergent nature
of water in the North Pacific Central Gyre (Masuzawa 1972) should result in
high densities there also." Day, etc... 1988, p. 261 (Emphasis
added)
Moore,
Charles (November 2003). "Across
the Pacific Ocean, plastics, plastics, everywhere". Natural
History Magazine.
Berton,
Justin (19 October 2007). "Continent-size
toxic stew of plastic trash fouling swath of Pacific Ocean". San
Francisco Chronicle. San Francisco: Hearst. pp. W�8.
Retrieved 22 October 2007.
Yap,
Britt (28 August 2008). "A
raft made of junk crosses Pacific in 3 months". USA Today.
Archived from the
original on 30 September 2009.
Retrieved 30 September 2009.
"Raft
made of junk bottles crosses Pacific". msnbc.
28 August 2008. Archived from the
original on 30 September 2009.
Retrieved 30 September 2009.
Jeavans,
Christine (20 August 2008). "Mid-ocean
dinner date saves rower". BBC News. Archived from the
original on 30 September 2009.
Retrieved 30 September 2009.
Walsh,
Bryan (1 August 2009). "Expedition
Sets Sail to the Great Plastic Vortex". Time.
Retrieved 2 August 2009.
Alison
Cawood (12 August 2009). "SEAPLEX
Day 11 Part 1: Midwater Fish " SEAPLEX". Archived from the
original on 8 October 2009. Retrieved 2
June 2016.
"Scientists
Find 'Great Pacific Ocean Garbage Patch'"
(Press release). National
Science Foundation. 27 August 2009. Archived
from the original on 28 August 2009.
Retrieved 8 August 2013.
"How
the oceans can clean themselves � Boyan Slat at TEDxDelft".
Retrieved 24 October 2012.
"Boyan
Slat: The Marine Litter Extraction Project � TEDxDelft". 5
October 2012. Retrieved 24
October 2012.
"Boyan
Slat � Marine Litter Extraction (In Depth)".
Retrieved 24 October 2012.
"The
Ocean Cleanup". Retrieved 24
October 2012.
Robarts,
Stu (25 August 2015). "Ocean
Cleanup project completes Great Pacific Garbage Patch research
expedition". www.gizmag.com.
Retrieved 25 August 2015.
Sea
Education Association. "Plastics
at SEA North Pacific Expedition".
Retrieved 9 December 2012.
Goldstein,
M. C.; Rosenberg, M.; Cheng, L. (2012). "Increased
oceanic microplastic debris enhances oviposition in an endemic pelagic
insect". Biology Letters. 8 (5): 817�20. doi:10.1098/rsbl.2012.0298.
PMC 3440973.
PMID 22573831.
"The
garbage patch territory turns into a new state". United Nations
Educational, Scientific and Cultural Organization.
"RIFIUTI
DIVENTANO STATO, UNESCO RICONOSCE 'GARBAGE PATCH' � SITI � PATRIMONIO
ITALIANO UNESCO". rivistasitiunesco.it. Archived from the
original on 3 November 2014.
Where
did the trash in the Great Pacific Garbage Patch come from? How do we stop
it?
Plastic
waste inputs from land into the ocean
Lavars,
Nick (17 October 2018). "Ocean
Cleanup system installed and ready for work at the Great Pacific Garbage
Patch". newatlas.com.
Retrieved 21 October 2018.
Dent,
Steve (11 September 2018). "A
project to remove 88,000 tons of plastic from the Pacific has begun".
engadget.com.
For
this and what follows, see David M. Karl, "A Sea of Change:
Biogeochemical Variability in the North Pacific Subtropical Gyre",
Ecosystems, Vol. 2, No. 3 (May � Jun. 1999), pp. 181�214 and, for gyres
generally, Sverdrup HU, Johnson MW, Fleming RH. 1946. The oceans, their
physics, chemistry and general biology. New York: Prentice-Hall.
Eriksen,
Marcus; Lebreton, Laurent C. M.; Carson, Henry S.; Thiel, Martin; Moore,
Charles J.; Borerro, Jose C.; Galgani, Francois; Ryan, Peter G.; Reisser,
Julia (10 December 2014). "Plastic
Pollution in the World's Oceans: More than 5 Trillion Plastic Pieces
Weighing over 250,000 Tons Afloat at Sea". PLOS One. 9
(12): e111913. Bibcode:2014PLoSO...9k1913E.
doi:10.1371/journal.pone.0111913.
ISSN 1932-6203.
PMC 4262196.
PMID 25494041.
Marine
Debris in the North Pacific (2011)
Ferris,
David (May � June 2009). "Message
in a bottle". Sierra. San Francisco: Sierra Club.
Retrieved 13 August 2009.
Faris,
J.; Hart, K. (1994). "Seas of Debris: A Summary of the Third
International Conference on Marine Debris". N.C. Sea Grant College
Program and NOAA.
"Garbage
Mass Is Growing in the Pacific". National
Public Radio. 28 March 2008.
"Plastic
pollution threatens to smother our planet". NewsComAu.
Retrieved 21 July 2017.
Brassey,
Dr Charlotte (16 July 2017). "A
mission to the Pacific plastic patch". BBC News.
Retrieved 21 July 2017.
Ryan,
P. G.; Moore, C. J.; Van Franeker, J. A.; Moloney, C. L. (2009). "Monitoring
the abundance of plastic debris in the marine environment". Philosophical
Transactions of the Royal Society B: Biological Sciences. 364
(1526): 1999�2012. doi:10.1098/rstb.2008.0207.
JSTOR 40485978.
PMC 2873010.
PMID 19528052.
cite
web|date=January 4, 2011 |url=http://www.katu.com/outdoors/featured/112901159.html+OSU:+Reports+of+giant+ocean+'garbage+patch'+are+exaggerated%7Ctitle=Ocean
Garbage Patch Area Exaggerated|archive-url=https://web.archive.org/web/20110214135534/http://www.katu.com/outdoors/featured/112901159.html%7Cdate=14
February 2011}}
"Oceanic
"garbage patch" not nearly as big as portrayed in media � News
& Research Communications � Oregon State University". oregonstate.edu.
4 January 2011.
Young,
Lindsay C.; Vanderlip, Cynthia; Duffy, David C.; Afanasyev, Vsevolod;
Shaffer, Scott A. (2009). Ropert-Coudert, Yan (ed.). "Bringing
Home the Trash: Do Colony-Based Differences in Foraging Distribution Lead to
Increased Plastic Ingestion in Laysan Albatrosses?". PLOS One.
4 (10): e7623. Bibcode:2009PLoSO...4.7623Y.
doi:10.1371/journal.pone.0007623.
PMC 2762601.
PMID 19862322.
www.theoceancleanup.com,
The Ocean Cleanup,. "The
Exponential Increase of the Great Pacific Garbage Patch". The
Ocean Cleanup. Retrieved 8
May 2018.
"What
is the Great Pacific Garbage Patch?". National
Ocean Service. Retrieved 25
August 2017.
Thompson,
R. C.; Olsen, Y; Mitchell, RP; Davis, A; Rowland, SJ; John, AW; McGonigle,
D; Russell, AE (2004). "Lost at Sea: Where is All the Plastic?". Science.
304 (5672): 838. doi:10.1126/science.1094559.
PMID 15131299.
Barnes,
D. K. A.; Galgani, F.; Thompson, R. C.; Barlaz, M. (2009). "Accumulation
and fragmentation of plastic debris in global environments". Philosophical
Transactions of the Royal Society B: Biological Sciences. 364
(1526): 1985�98. doi:10.1098/rstb.2008.0205.
JSTOR 40485977.
PMC 2873009.
PMID 19528051.
Barry,
Carolyn (20 August 2009). "Plastic
Breaks Down in Ocean, After All � And Fast". National
Geographic News. National
Geographic Society. Retrieved 30
August 2009.
Moore,
C.J; Moore, S.L; Leecaster, M.K; Weisberg, S.B (2001). "A Comparison of
Plastic and Plankton in the North Pacific Central Gyre". Marine
Pollution Bulletin. 42 (12): 1297�300. doi:10.1016/S0025-326X(01)00114-X.
PMID 11827116.
Wright,
Pam (6 June 2017). "UN
Ocean Conference: Plastics Dumped In Oceans Could Outweigh Fish by 2050,
Secretary-General Says". The Weather Channel.
Retrieved 5 May 2018.
Holmes,
Krissy (18 January 2014). "Harbour
snow dumping dangerous to environment: biologist". CBC.
"Beached
whale in Spain dies from ingesting plastic waste" Agence France-Presse
7 March 2013 Archived
6 June 2014 at the Wayback
Machine
Gibbs,
Susan E.; Salgado Kent, Chandra P.; Slat, Boyan; Morales, Damien; Fouda,
Leila; Reisser, Julia (9 April 2019). "Cetacean sightings within the
Great Pacific Garbage Patch". Marine Biodiversity. doi:10.1007/s12526-019-00952-0.
Chris
Jordan (11 November 2009). "Midway:
Message from the Gyre".
Retrieved 13 November 2009.
"Q&A:
Your Midway questions answered". BBC News. 28 March 2008.
Retrieved 5 April 2010.
Moore,
Charles (2 October 2002). "Great Pacific Garbage Patch". Santa
Barbara News-Press.
Plastic-Filled
Albatrosses Are Pollution Canaries in New Doc. Wired. 29 June 2012.
Accessed 6-11-13
"Rubbish
haul found in stomach of dead whale". 27 October 2015.
"9
of 10 seabirds have swallowed plastic garbage � CBC News".
"Ocean
plastic is the new DDT, Canadian scientist warns". CBC. 11
September 2015.
"Pacific
sea birds dine on trash: researchers". CBC. 27 October 2009.
Hoare,
Philip (30 March 2016). "Whales
are starving � their stomachs full of our plastic waste". The
Guardian.
Rios,
Lorena M.; Moore, Charles; Jones, Patrick R. (2007). "Persistent
organic pollutants carried by synthetic polymers in the ocean
environment". Marine Pollution Bulletin. 54 (8):
1230�7. doi:10.1016/j.marpolbul.2007.03.022.
PMID 17532349.
Tanabe,
Shinsuke; Watanabe, Mafumi; Minh, Tu Binh; Kunisue, Tatsuya; Nakanishi,
Shigeyuki; Ono, Hitoshi; Tanaka, Hiroyuki (2004). "PCDDs, PCDFs, and
Coplanar PCBs in Albatross from the North Pacific and Southern Oceans:
Levels, Patterns, and Toxicological Implications". Environmental
Science & Technology. 38 (2): 403�13. Bibcode:2004EnST...38..403T.
doi:10.1021/es034966x.
PMID 14750714.
Rogers,
Paul (1 September 2009). "'Pacific
Garbage Patch' expedition finds plastic, plastic everywhere". The
Mercury News. Retrieved 4
October 2009.
Allsopp,
Michelle; Walters, Adam; Santillo, David; Johnston, Paul (2007). Plastic
Debris in the World's Oceans (PDF)
(Report). Greenpeace.

FAST
FOOD
- It's not just fast food, it
is our exploitative society that is poisoning the planet, without thought
for the consequences. We've been living at artificially low prices at the
expense of killing other life on earth.
|