|
GYRES GREAT PACIFIC GARBAGE PATCH PLEASE USE OUR A-Z INDEX TO NAVIGATE THIS SITE
|
|
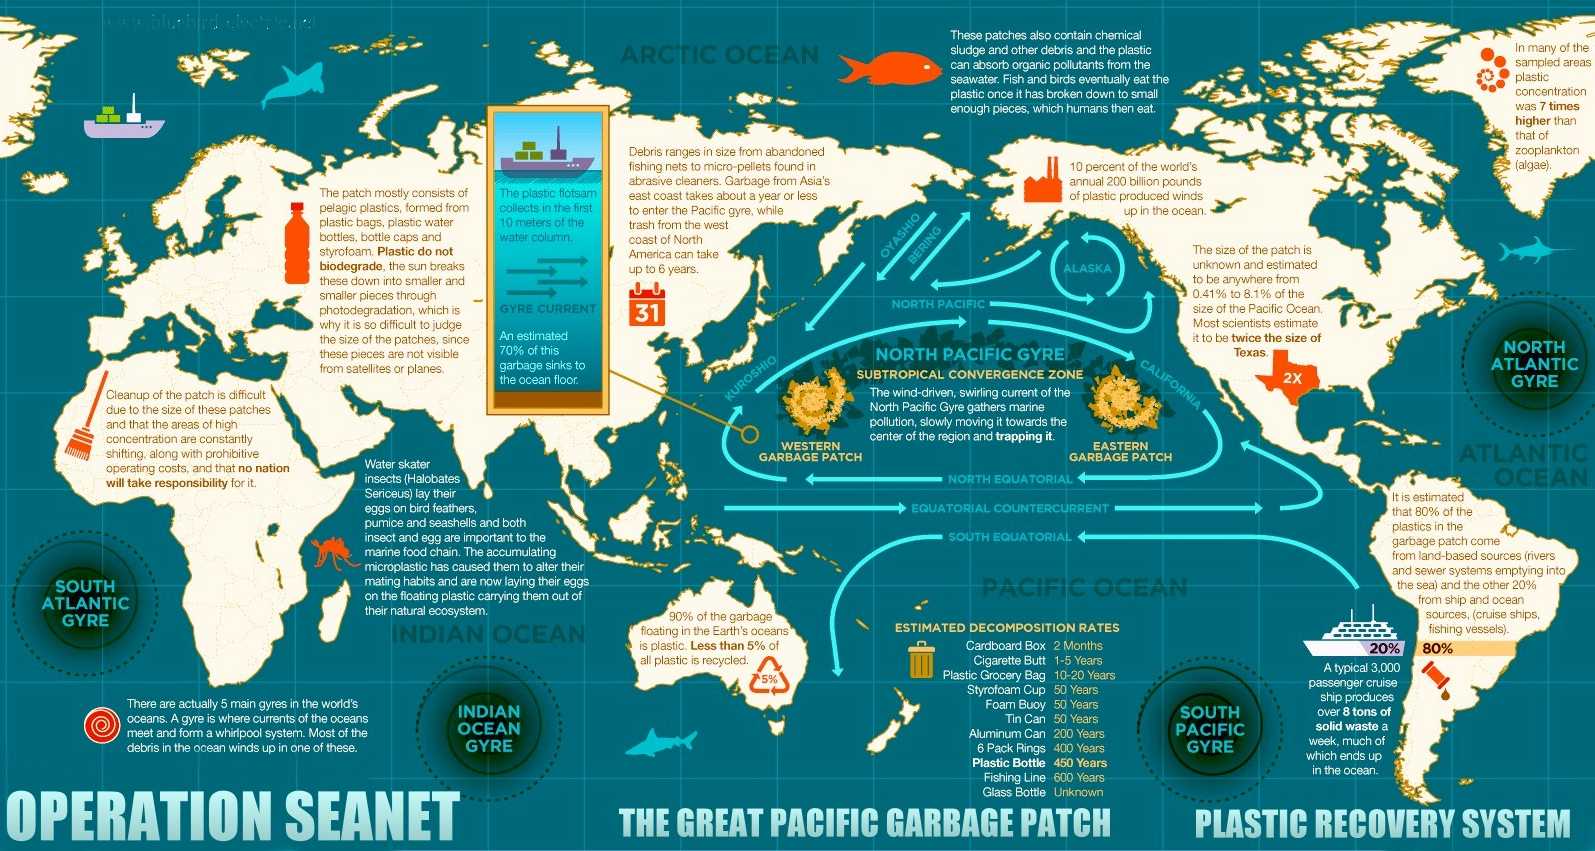
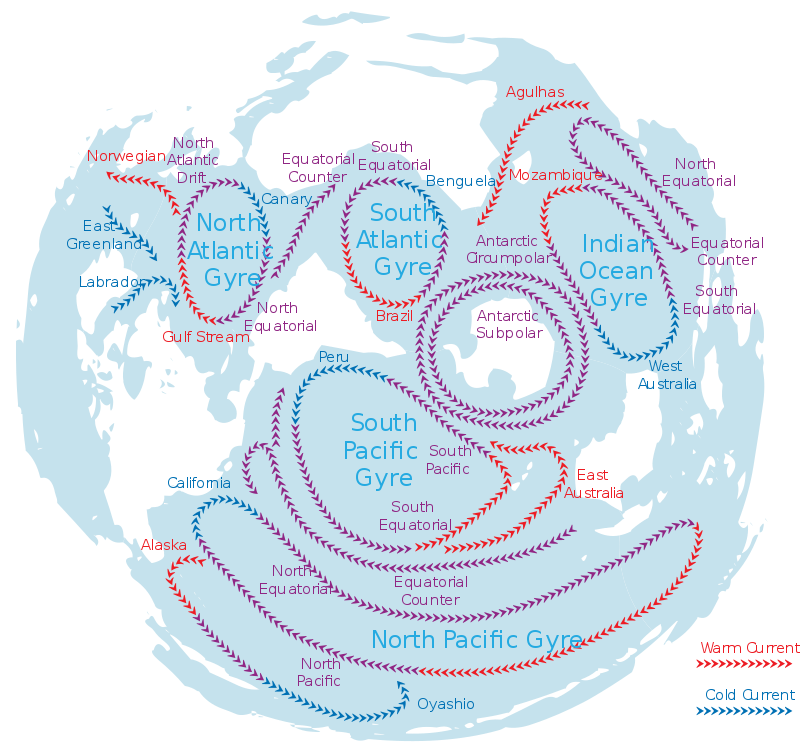
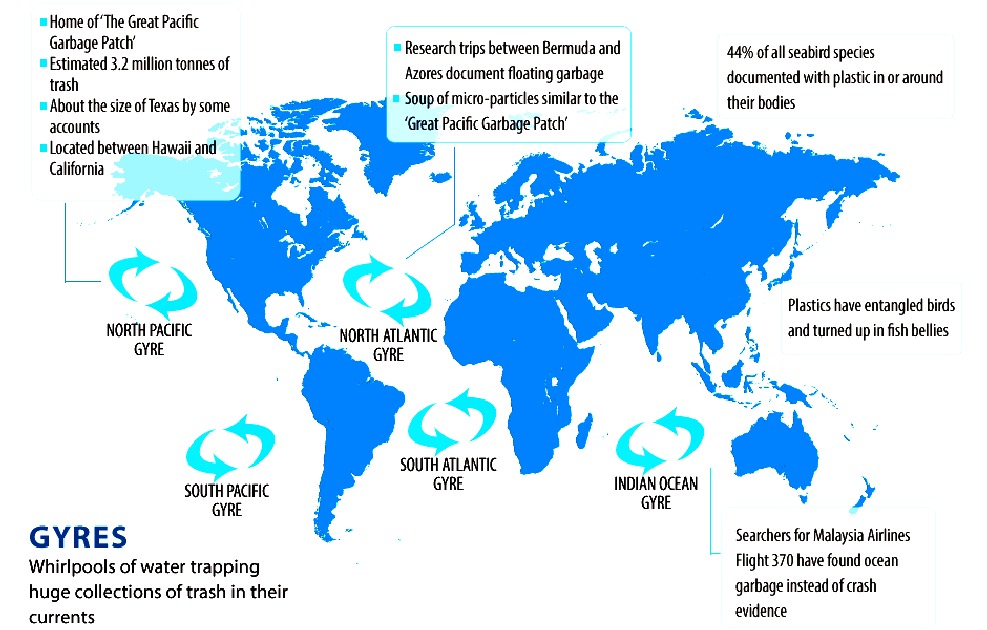
There are 5 swirling ocean garbage patches called gyres. Garbage patches generally accumulate far from any country’s coastline, and it is nearly impossible to track the origin of marine debris. The tiny plastic particles that make up most of the patches are also very difficult and expensive to detect and remove.
6. Arctic Ocean
BUT WHAT IS THE SIZE OF THE GREAT PACIFIC GARBAGE PATCH?
The real answer is: no one really knows and it is getting bigger. It’s much harder to measure how big something is in water compared to when it is on land.
The Pacific Ocean itself is estimated to be between 155,557,000 and 165,250,000 square kilometres! The Great Pacific Garbage Patch is thought to be between 700,000 and 15,000,000 square kilometres - estimated to cover an area of approximately 1.6 million square km.
These numbers are so big that it’s hard to picture an area of that size.
Estimates also say that the Patch is no smaller than the state of New South Wales. Other researchers believe it to be more extensive, possibly even larger than the Australian continent.
Using maps of the Great Pacific Garbage Patch and a conservative estimate of the Patch’s size (1,000,000 square kilometres), how many times could your state or territory fit into the Great Pacific Garbage Patch?
Thinking about it this way might help you to understand just how big the area is!
Your
teachers
may ask you to cut up a map of Australia so that your state is a piece on its own. See
how many times your state or territory fits into the Patch. Make sure the
maps you use are to the same scale. You can use the following information to
calculate it yourself:
Researchers followed the location of the patch by simulation of concentration levels in the North of the Pacific. They were able to demonstrate the important seasonal and inter-annual variations and they were able to determine the patch rotates around 32°N and 145°W. With time, the team of researchers was able to note that there was a shift from the west to the east. There was also substantial variation in the latitude which was dependent on the year.
Where the Great Pacific Garbage Patch is estimated to cover an area of approximately 1.6 million square kilometers, researchers from the Ocean Cleanup Project, who are focusing on this gyre, used a very elaborate sampling method to formulate the size of the Great Pacific Patch.
A total number of 652 surface nets, a fleet of 30 boats and two flights were used in this sampling method to get the picture of the debris. Different locations were also sampled so that the accuracy of the sampling method would increase.
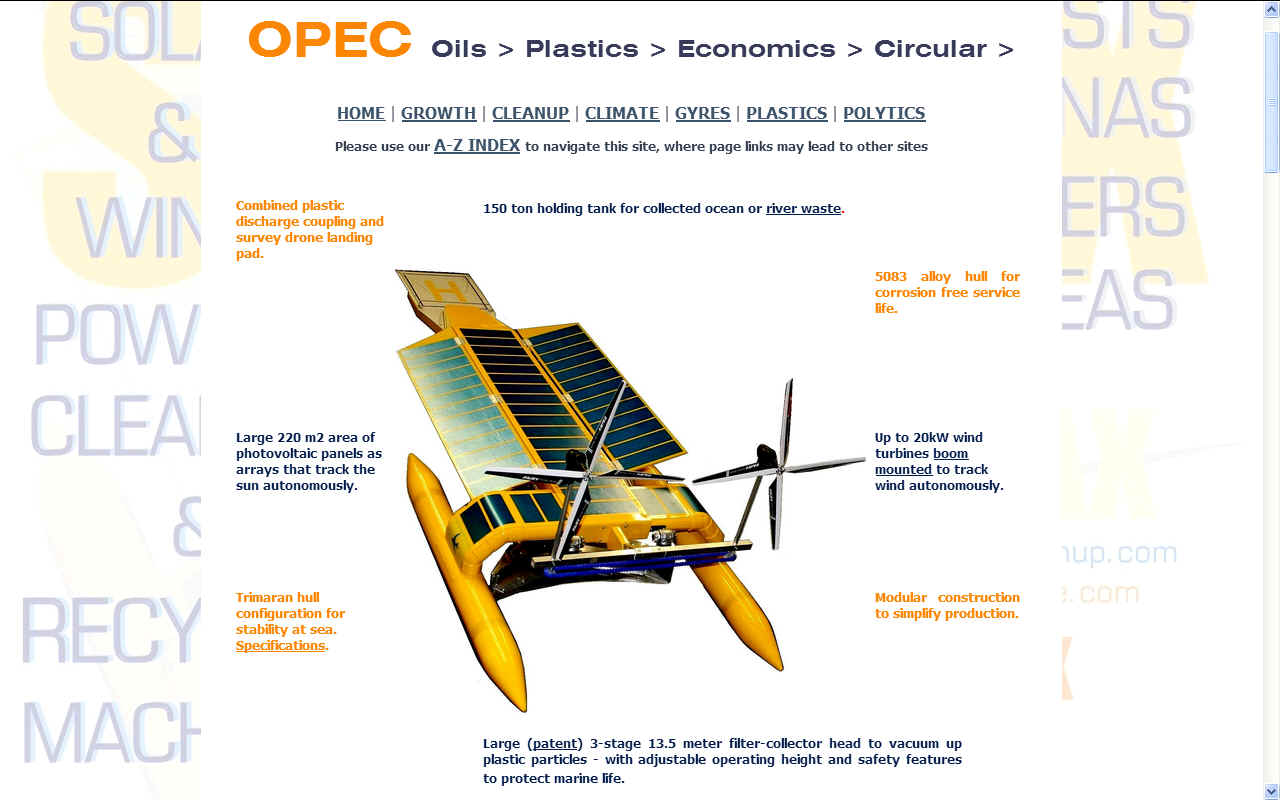
RECYCLING PLASTIC - With the right level of funding and other international political support for such projects, plastic can be recovered and brought back into the economy in a sustainable way such as to aid the creation of a circular economy.
Such estimates, however, are conjectural given the complexities of sampling and the need to assess findings against other areas. Further, although the size of the patch is determined by a higher-than-normal degree of concentration of pelagic debris, there is no standard for determining the boundary between "normal" and "elevated" levels of pollutants to provide a firm estimate of the affected area.
Floating debris typically is sampled with a neuston or manta trawl net lined with 0.33 mm mesh. Given the very high level of spatial clumping in marine litter, large numbers of net tows are required to adequately characterize the average abundance of litter at sea. Long-term changes in plastic meso-litter have been reported using surface net tows: in the North Pacific Subtropical Gyre in 1999, plastic abundance was 335,000 items/km2 and 5.1 kg/km2, roughly an order of magnitude greater than samples collected in the 1980s. Similar dramatic increases in plastic debris have been reported off Japan.
However, caution is needed in interpreting such findings, because of the problems of extreme spatial heterogeneity, and the need to compare samples from equivalent water masses, which is to say that, if an examination of the same parcel of water a week apart is conducted, an order of magnitude change in plastic concentration could be observed.
In order to also account for the larger, but more rare larger debris, they also overflew the patch in 2016 with a C-130 Hercules aircraft, equipped with LiDAR sensors. The findings from the two expeditions, found that the patch covers 1.6 million square kilometers with a concentration of 10–100 kg per square kilometer. They estimate an 80,000 metric tons in the patch, with 1.8 trillion plastic pieces, out of which 92% of the mass is to be found in objects larger than 0.5 centimeters.
LINKS & REFERENCES
https://www.worldatlas.com/articles/what-is-the-great-pacific-garbage-patch.html
|
|
|
ABS - BIOMAGNIFICATION - CANCER - CARRIER BAGS - COTTON BUDS - DDT - FISHING NETS HEAVY METALS - MARINE LITTER - MICROBEADS - MICRO PLASTICS - NYLON - OCEAN GYRES - OCEAN WASTE PACKAGING - PCBS - PET - PLASTIC - PLASTICS - POLYCARBONATE - POLYSTYRENE - POLYPROPYLENE - POLYTHENE - POPS PVC - SHOES - SINGLE USE - SOUP - STRAWS - WATER
|
|
|
This website is provided on a free basis as a public information service. copyright © Cleaner Oceans Foundation Ltd (COFL) (Company No: 4674774) 2019. Solar Studios, BN271RF, United Kingdom. COFL is a company without share capital.
|