|
WHERE IS BIODIVERSITY MOST AT RISK PLEASE USE OUR A-Z INDEX TO NAVIGATE THIS SITE
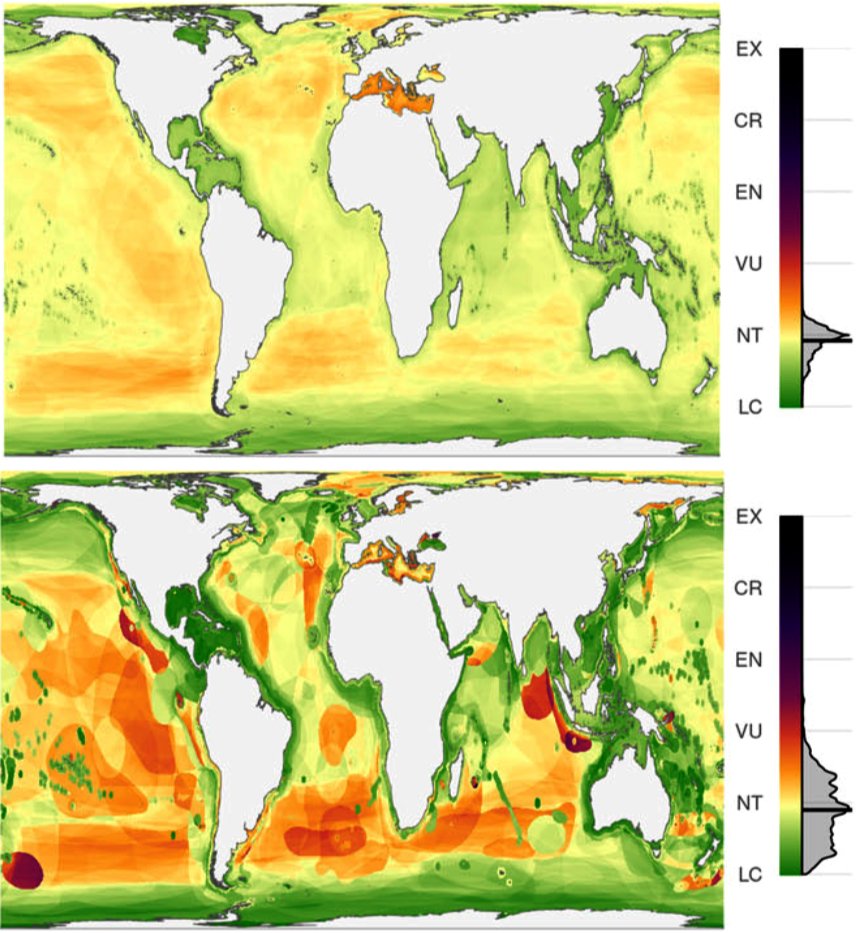
20% OF OCEAN SPECIES THREATENED - In 83% of the ocean, at least a quarter of the species are threatened. Regions like the Mediterranean and Black seas showed the highest risks to biodiversity, the study reports.
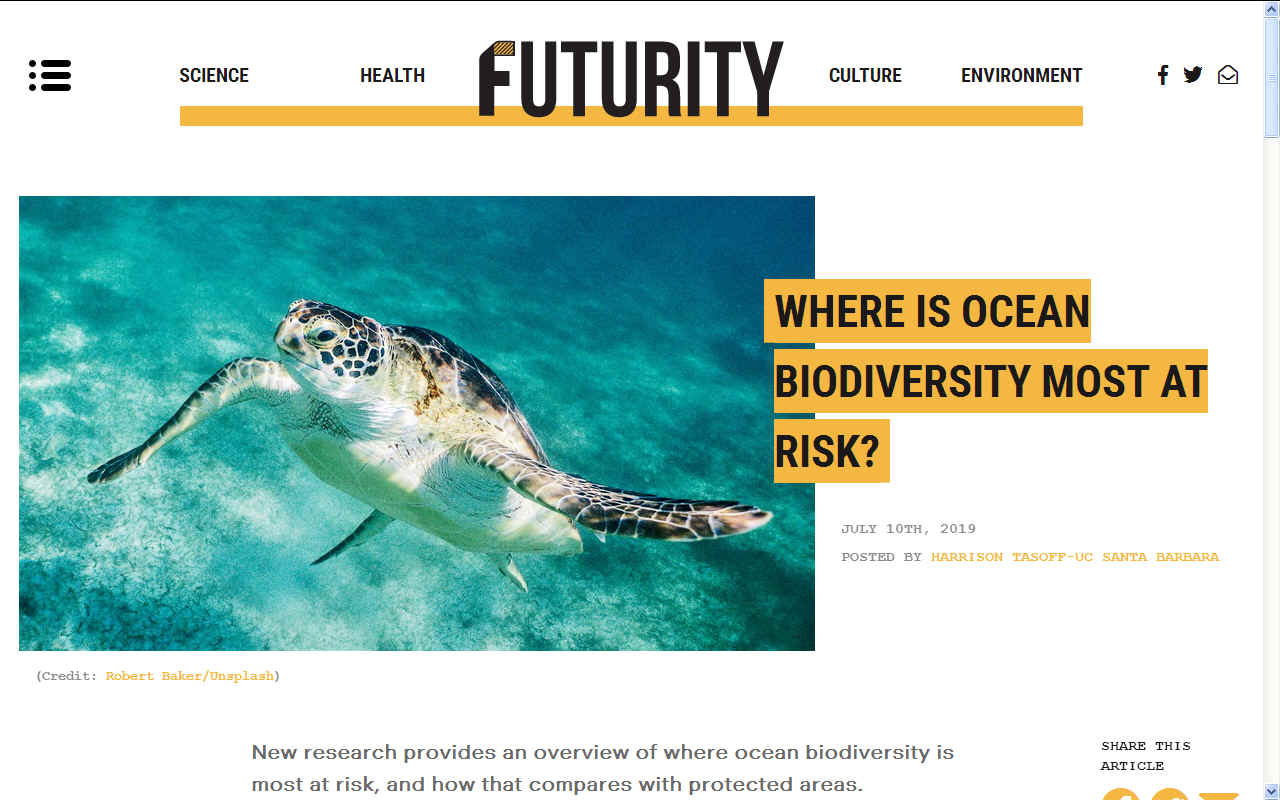
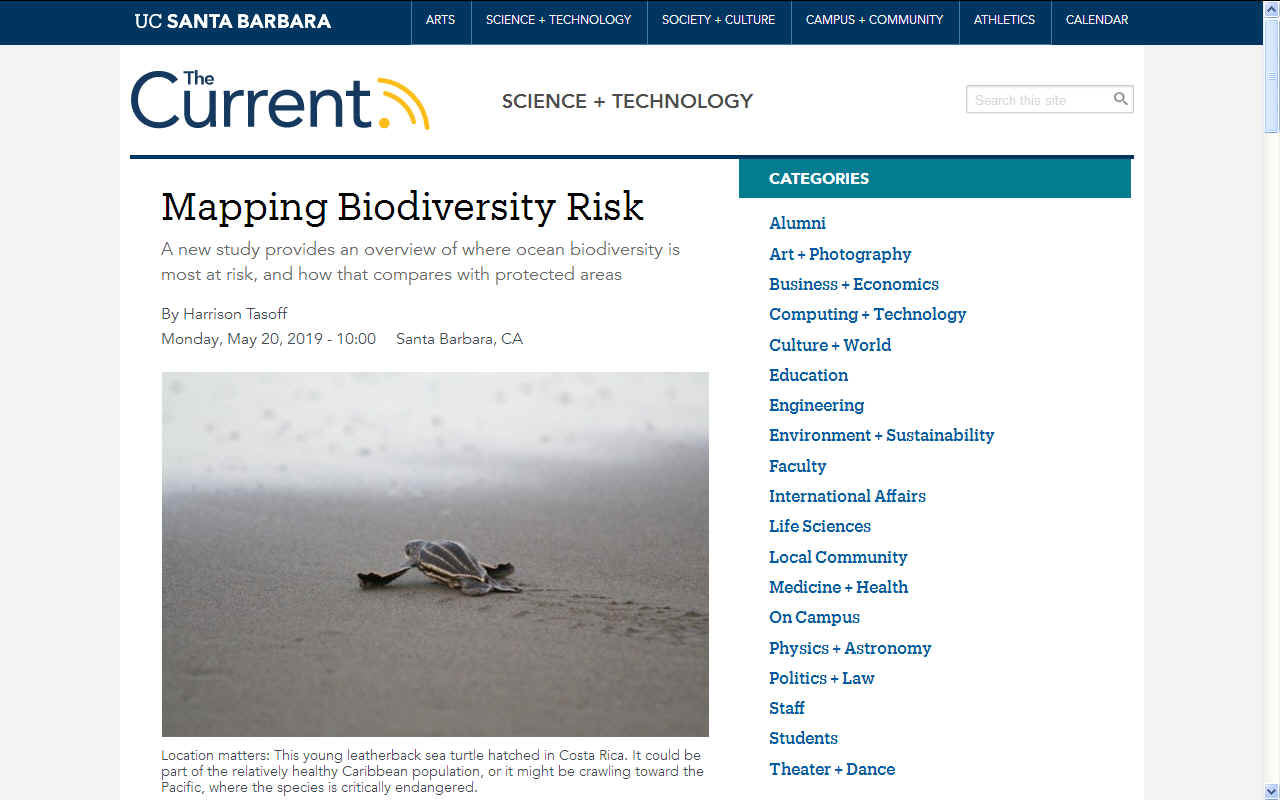
New research provides an overview of where ocean biodiversity is most at risk, and how that compares with protected areas.
The global biodiversity picture
Abstract - To conserve marine biodiversity, we must first understand the spatial distribution and status of at risk biodiversity. We combined range maps and conservation status for 5,291 marine species to map the global distribution of extinction risk of marine biodiversity. We find that for 83% of the ocean, >25% of assessed species are considered threatened, and 15% of the ocean shows >50% of assessed species threatened when weighting for range limited species. By comparing mean extinction risk of marine biodiversity to no take marine reserve placement, we identify regions where reserves preferentially afford proactive protection (i.e., preserving low risk areas) or reactive protection (i.e., mitigating high risk areas), indicating opportunities and needs for effective future protection at national and regional scales. In addition, elevated risk to high seas biodiversity highlights the need for credible protection and minimization of threatening activities in international waters.
Two conservation strategies
CASEY O'HARA - O’Hara averaged the extinction risk across species in a given region to see where biodiversity was most at risk. He also weighted the results by species’ range size to emphasize the status of rare species and those with tight ranges. See image below.
STUDY INTRODUCTION
Global oceans face increasing pressures from the direct and indirect consequences of human activities, including climate change (Poloczanska et al., 2016), fishing, pollution, and habitat destruction (Halpern et al., 2008, 2015). These stressors threaten the sustainability and existence of marine biodiversity (Dulvy, Sadovy, & Reynolds, 2003; Sala & Knowlton, 2006) and the suite of benefits these ecosystems provide (McCauley et al., 2015; Worm et al., 2006). Recognizing these threats, the Aichi Biodiversity Targets adopted by the United Nations Convention on Biodiversity (CBD) in 2010 incorporate strategic goals to counteract the decline in global biodiversity.
In particular, Aichi Target 11 sets a target of effective protection of 10% of marine areas particularly important to biodiversity and ecosystem services by 2020 (Leadley et al., 2014). Determining whether actions taken to meet this target are effectively addressing conservation goals requires, at a minimum, identifying regions where biodiversity is at risk, and to what extent, relative to current protection and management. A baseline assessment of global marine biodiversity conservation status relative to existing marine protection will be critical to inform renegotiations of protection targets toward a post‐2020 biodiversity framework.
Marine conservation prioritization literature critically relies on understanding the spatial distribution of biodiversity (Klein et al., 2015; Roberts, 2002; Selig et al., 2014) to identify interventions that can effectively mitigate human impacts and slow or reverse the global decline of marine species. Two complementary strategies are often cited for prioritizing areas for marine protection: reactive approaches that protect highly impacted areas to mitigate stressors and allow for recovery, and proactive interventions that preserve areas of low current impact to prevent future degradation (Brooks et al., 2006). Extractive uses impose direct human impacts on the marine environment, and therefore reactive protection, in closing access to valuable resources, often faces political and economic opposition.
Focusing on areas of low commercial value may minimize opportunity cost but will likely result in residual reserves that provide little protection for species and ecosystems most threatened by extractive activities (Devillers et al., 2015). However, prioritization approaches, particularly at the global scale, often rely on species richness measures that do not account for conservation status (i.e., risk of extinction in the near future) of marine biodiversity in the face of threats and impacts (e.g., Roberts, 2002; Selig et al., 2014). Understanding where to target conservation initiatives to improve the conservation status of at‐risk marine biodiversity poses a particularly pressing and important challenge.
Here, we combine spatial range and extinction risk data for 5,291 marine species on the IUCN Red List of Threatened Species to map the mean conservation status of marine biodiversity (hereafter “biodiversity risk”) at a resolution relevant to policy makers. We then compare biodiversity risk scores with existing marine reserve coverage and ecologically important habitats to highlight places that harbor few at‐risk species and merit protection from future degradation (i.e., proactive protection), as well as areas of elevated risk that would benefit from protection to mitigate existing threats (i.e., reactive protection). This work provides a critical global map of marine biodiversity risk, improving our understanding of its spatial distribution and providing a necessary tool to highlight gaps and opportunities for effective marine conservation.
STUDY DISCUSSION
These results provide a detailed spatial understanding of the distribution of conservation status of global marine biodiversity. Comparing biodiversity risk against existing marine reserves highlights the balance within regional (Figure 3) and national waters (Tables S2 and S3) between reactive and proactive protection of marine ecosystems. Although a “correct” balance is a normative question not addressed here, understanding the distribution of biodiversity risk under current protection stands to better inform development of targets for effective future protection.
Regions and nations in which existing marine reserves focus primarily on areas of higher biodiversity risk (e.g., Figure 3: North and South America; Tables S2 and S3: United States, New Zealand, and Brazil), whether by design or by chance, may have an opportunity to develop proactive protection with minimal displacement of human activity. Conversely, regions and nations whose marine reserves disproportionately protect lower‐risk biodiversity (e.g., Figure 3: Europe and Central America/Caribbean; Tables S2 and S3: Egypt and Canada) may have to accept difficult tradeoffs in opportunity cost to increase reactive protection of heavily impacted areas.
The small apparent increase in protection of at‐risk endemic biodiversity since establishment of the Aichi targets in 2010 (Figure 3: Global EEZ post‐Aichi) may indicate a shift in recent marine policy to preferentially protect degraded areas, or may be evidence of greater effectiveness of long‐established MPAs in promoting biodiversity health (Edgar et al., 2014). It may also result from recent trends toward establishing very large MPAs (Toonen et al., 2013), which frequently extend into oceanic waters with fewer species but higher mean risk.
Aichi Target 11 strives toward, among other things, “ecologically representative” systems of protected areas. Existing protection of most coastal ecosystems is well balanced, in that biodiversity risk under protection reasonably matches the overall distribution of biodiversity risk. In kelp forests and shallow sandy bottom habitats, however, mean risk under protection is far lower than unprotected mean risk, suggesting either proactive protection or, more likely, residual reserves. Both ecosystem types would benefit from efforts to identify and protect highly impacted areas to reduce risk to extant biodiversity. The same is true of open oceanic waters: unprotected open ocean falling within EEZ jurisdiction is at generally greater risk than waters falling within the large MPAs that make up much of the protected open ocean.
Our results show disproportionately high risk to high seas biodiversity relative to that within EEZs, with little in the way of protection from extractive activities. Currently established no‐take reserves cover only 1% of the high seas, proactively protecting low‐risk Southern Ocean biodiversity (IUCN & UNEP‐WCMC, 2018). Among other stressors, fisheries are a significant economic activity impacting biodiversity across the high seas: between 48% and 57% of the high seas were fished in 2016 (Sala et al., 2018). High seas fishing effort provides only 4.2% of total wild capture production (Schiller, Bailey, Jacquet, & Sala, 2018), but is dominated by longline fisheries (Kroodsma et al., 2018b), known for high bycatch rates for marine mammals, seabirds, and sea turtles (Lewison et al., 2014). Although monitoring and enforcement would be a significant challenge, establishment of marine reserves in the high seas and improving ocean governance could protect high‐risk biodiversity while imposing little impact on food security (Schiller et al., 2018) and likely increasing profitability of fisheries in EEZs (White & Costello, 2014).
Coordination and enforcement of policy at national and subnational levels is far more tractable than international coordination, and can more readily target localized threats to biodiversity and account for local contexts and values. Examining distributions of risk at the EEZ scale (Tables S2 and S3) may be useful to inform national or local marine conservation efforts. However, while our results provide a valuable heuristic for identifying conservation opportunities, this present analysis is primarily based on global extinction risk assessments and is not able to capture the heterogeneity of conservation status of local subpopulations. Additionally, the IUCN range maps used to describe species presence do not contain information on distribution within the outlined range; additional information on relative abundance, environmental suitability, or area of occupancy would be valuable in better identifying species presence. To better inform conservation planning initiatives at these finer spatial scales, the methods presented here can and should be adapted to incorporate scale‐relevant species risk assessments and range maps at finer spatial resolution.
We emphasize that our results, though derived from aggregating a broad sample of species‐level assessments, are intended to estimate system‐level risk to the total biodiversity within an ecosystem. Although the species included in this analysis represent only a small fraction of marine life (Mora, Tittensor, Adl, Simpson, & Worm, 2011), the included taxa represent ecologically essential habitat‐building species (corals, seagrasses, and mangroves), a wide cross section of bony fishes, a large proportion of other marine vertebrates—many of which serve as iconic species—and several commercially important invertebrate groups. Importantly, the included taxa contain most large marine predators, which are useful surrogates for ecosystem health as biodiversity indicators and sentinel species (Sergio et al., 2008); as such, their inclusion in this analysis of system‐level risk is particularly valuable. Future analyses will benefit from continuing rapid addition of species to the Red List (Figure S3) in comprehensively assessed taxonomic groups.
Focusing on small‐ranged endemics may provide a richer understanding of risk to local biodiversity, but may underestimate the ecological contribution of wide‐ranging species, including large marine predators. The correlation between uniform‐weighted and range rarity–weighted risk (adjusted R2 = .508 for global maps) suggests that it may be counterproductive to use both measures simultaneously. The choice of weighting, as in any indicator exercise, largely depends on the goal of an assessment or conservation measure.
Although our analysis focused on species weightings analogous to two commonly applied biodiversity metrics, other weighting schemes, for example, by functional group or trophic level, may provide additional important insights for conservation (Vačkář, ten Brink, Loh, Baillie, & Reyers, 2012). The choice of an equal‐steps numeric scale for conservation status is based on Red List Index methodology (Butchart et al., 2004), but other status‐weighting scales may better capture extinction risk (Butchart et al., 2004) or perceptions of risk (Selig et al., 2013).
Variance of biodiversity risk, calculated as the variance of conservation status among all assessed species found in each cell (Figure S4), could have important implications for management decisions beyond the place‐based conservation examined in this study. An area with systemic biodiversity risk (i.e., high mean, low variance) may benefit from broad protection or ecosystem‐based management strategies, while high risk driven by a few outliers (i.e., high variance) may indicate an opportunity for targeted management (e.g., single species quotas and gear restrictions) while imposing little harm on other ocean uses.
Marine biodiversity risk is spatially heterogeneous and varies substantially according to geography and taxonomy. Well designed and targeted conservation measures are critical to maintaining the vitality of biodiverse ecosystems at low risk and allowing highly impacted ecosystems to recover.
Spatial understanding of marine biodiversity extinction risk relative to existing marine protection can be a valuable tool to identify needs and opportunities for future conservation at national, regional, and global scales, especially when used in conjunction with spatial distributions of human impacts and systematic conservation planning tools. Matching marine biodiversity risk with areas of high and low human impact can illuminate cost‐effective opportunities for balancing protection of at‐risk and pristine ecosystems as we strive toward Aichi marine protection targets for 2020 and beyond.
IUCN Red List species rangemaps and data are publicly available at www.iucnredlist.org. Protected area data are publicly available at www.protectedplanet.net. All resulting data and code are available at https://github.com/oharac/spp_risk_dists.
CONTACTS
Harrison Tasoff
The Convention on Biological Diversity (CBD), known informally as the Biodiversity Convention, is a multilateral treaty with three main goals:
1. the conservation of biological diversity (or biodiversity); 2. the sustainable use of its components and; 3.
the fair and equitable sharing of benefits arising from genetic resources.
EXECUTIVE SECRETARY - Cristiana Pașca Palmer was appointed by the United Nations Secretary-General as the Executive Secretary of the Secretariat of the Convention on Biological Diversity, starting 17 March 2017.
CONTACTS
Secretariat of the Convention on Biological Diversity
BIODIVERSITY COP HISTORY
CLIMATE CHANGE UN COP HISTORY
DESERTIFICATION COP HISTORY
- LINKS & REFERENCE
https://onlinelibrary.wiley.com/doi/full/10.1111/conl.12651 https://www.news.ucsb.edu/2019/019476/mapping-biodiversity-risk https://www.futurity.org/biodiversity-oceans-extinction-2101612/
This website is provided on a free basis as a public information service. copyright © Cleaner Oceans Foundation Ltd (COFL) (Company No: 4674774) 2019. Solar Studios, BN271RF, United Kingdom. COFL is a company without share capital.
|